Inside IntraSec: building a client-less network vulnerability scanner
IntraSec was my senior project at FAST-NUCES, built with Muhammad Ahmad Hanif and supervised by Dr. Muhammad Asim. The brief: scan an internal corporate network for vulnerabilities without installing an agent on any machine. The client-less constraint sounds like a limitation someone added to make the project harder. It's actually the whole problem. Everything interesting in the architecture comes from that one decision.
The asset inventory problem
Active Directory is supposed to be the source of truth for machines on a corporate network. In practice it's more of a historical record. It has entries for machines decommissioned two years ago. It's missing the server someone spun up for a client demo and forgot to register. It has no idea about the Raspberry Pi plugged into a conference room ethernet port. The gap between "what AD says" and "what's actually responding on the wire" is exactly where the unmanaged, unpatched, and forgotten machines live, and those are the machines that tend to become problems.
A scanner that starts from the AD inventory inherits all those gaps. So IntraSec builds its own picture of the network first, using AD as a starting point but not as a boundary. Only after we have that picture do we ask what's wrong with each thing in it.
Why five services
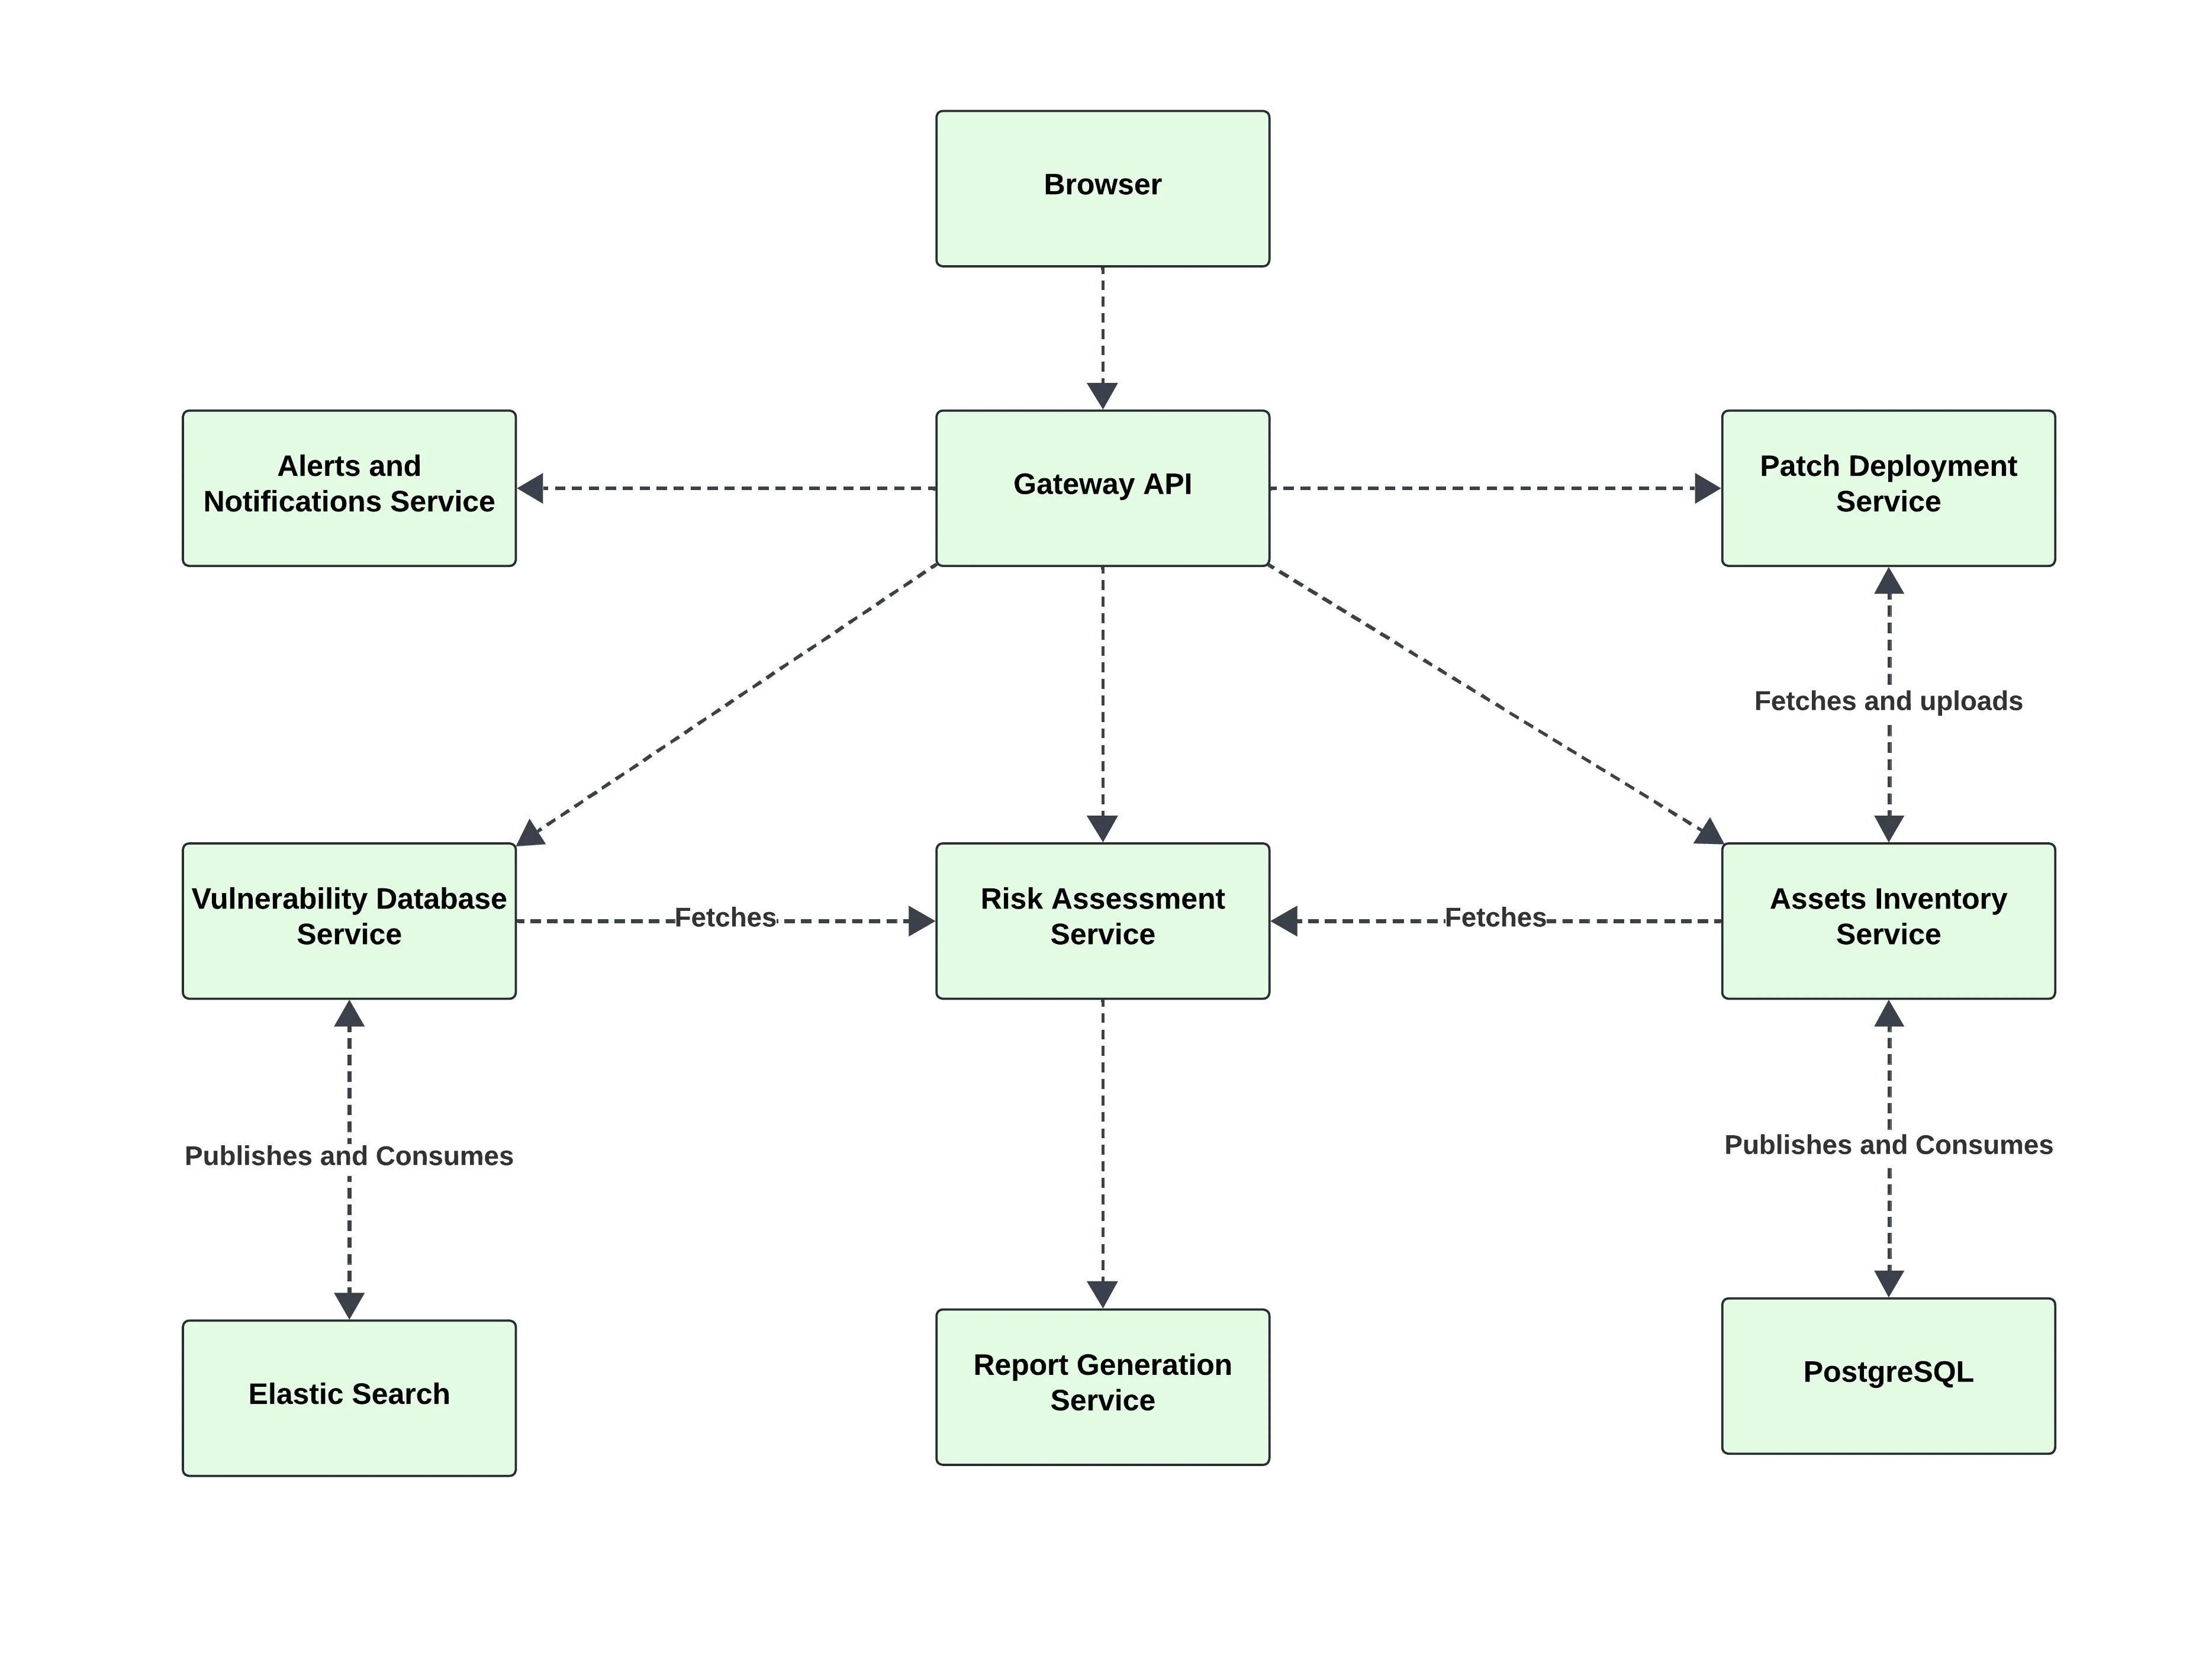
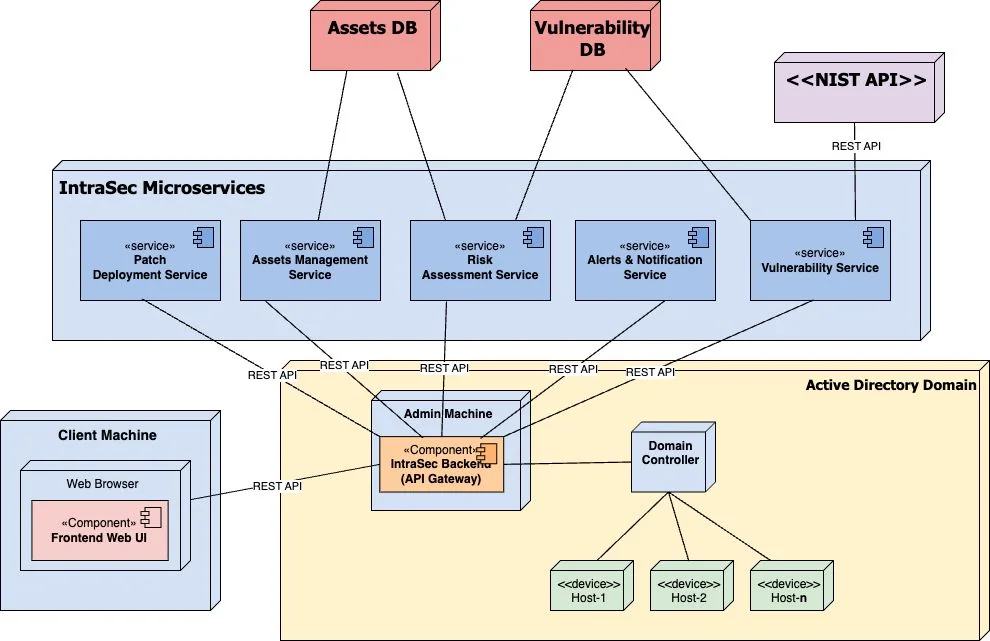
The system is five microservices behind a Gateway API, with a Next.js frontend, communicating over REST. We didn't split it up for architectural points. The problem genuinely resists a single language or runtime. Network enumeration needs concurrency, and Go's goroutine model handles hundreds of simultaneous LDAP queries and PowerShell sessions cleanly. Risk scoring runs numerical algorithms that are better expressed in Python, with scientific libraries that don't have Go equivalents worth using. CVE lookup is a search problem, and fighting a relational database into doing CPE string matching with version ranges is the wrong fight. Each service got the runtime that made its specific problem easier to write correctly.
How discovery actually works
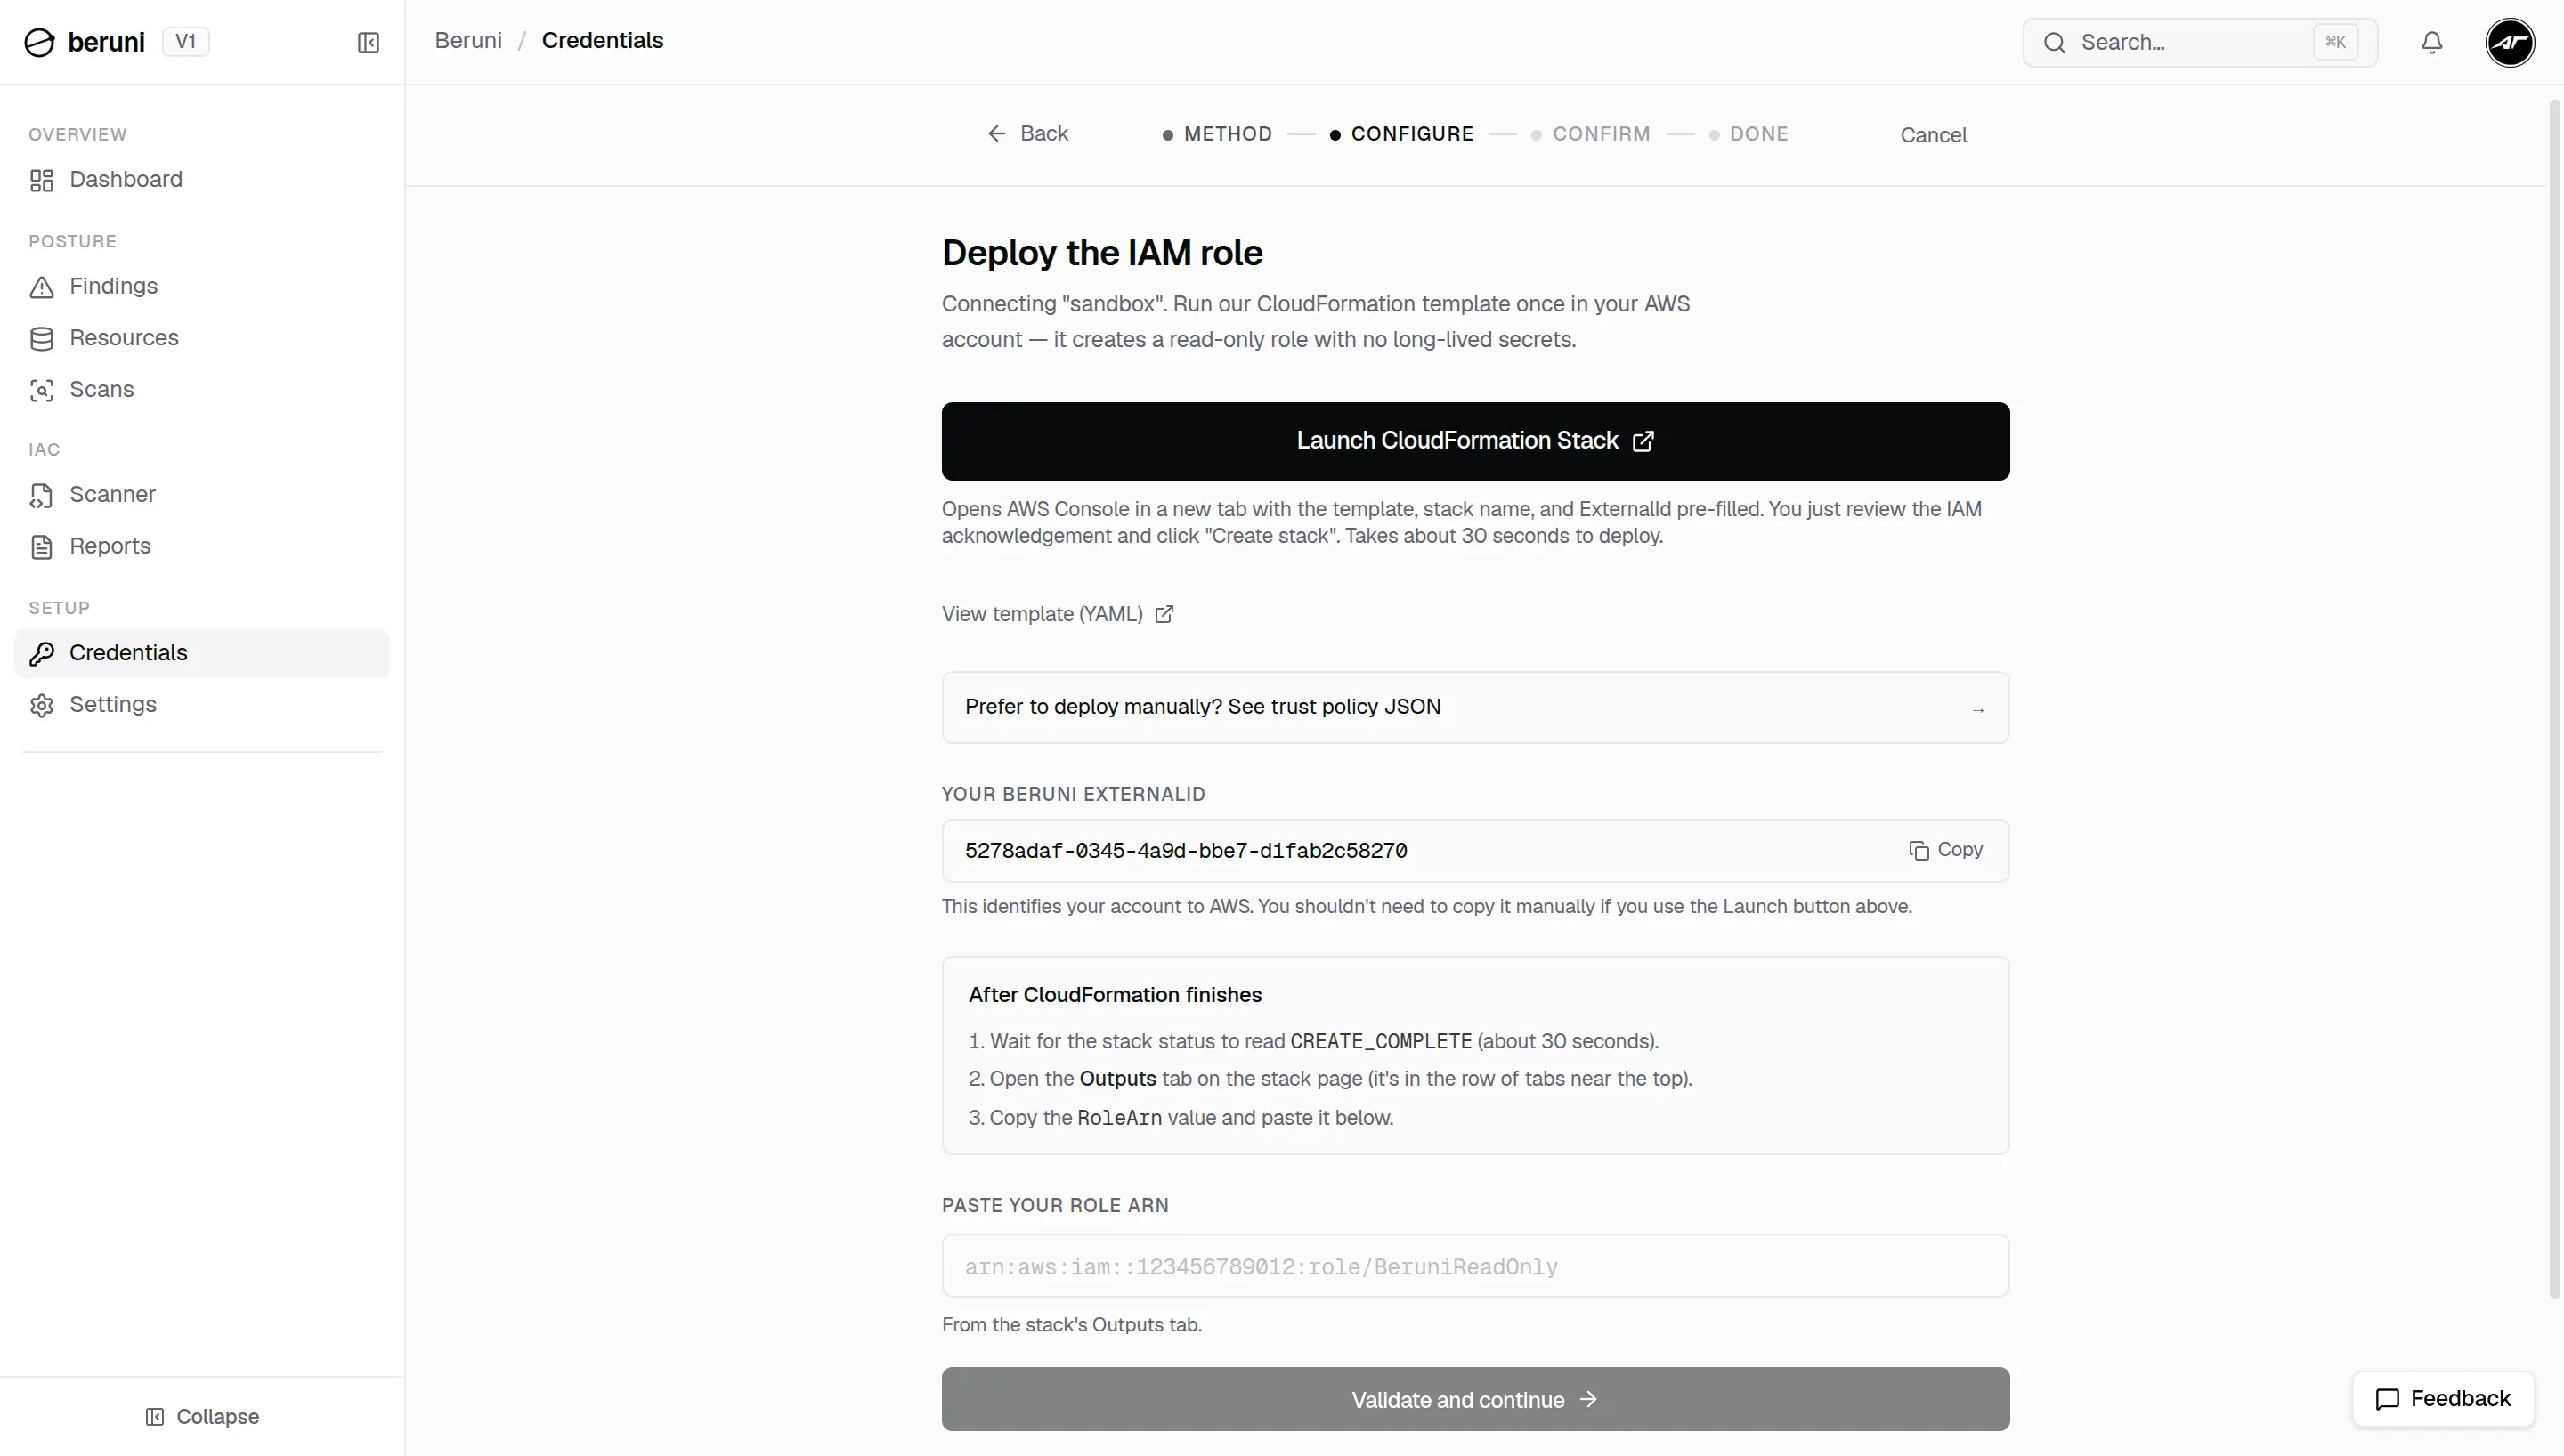
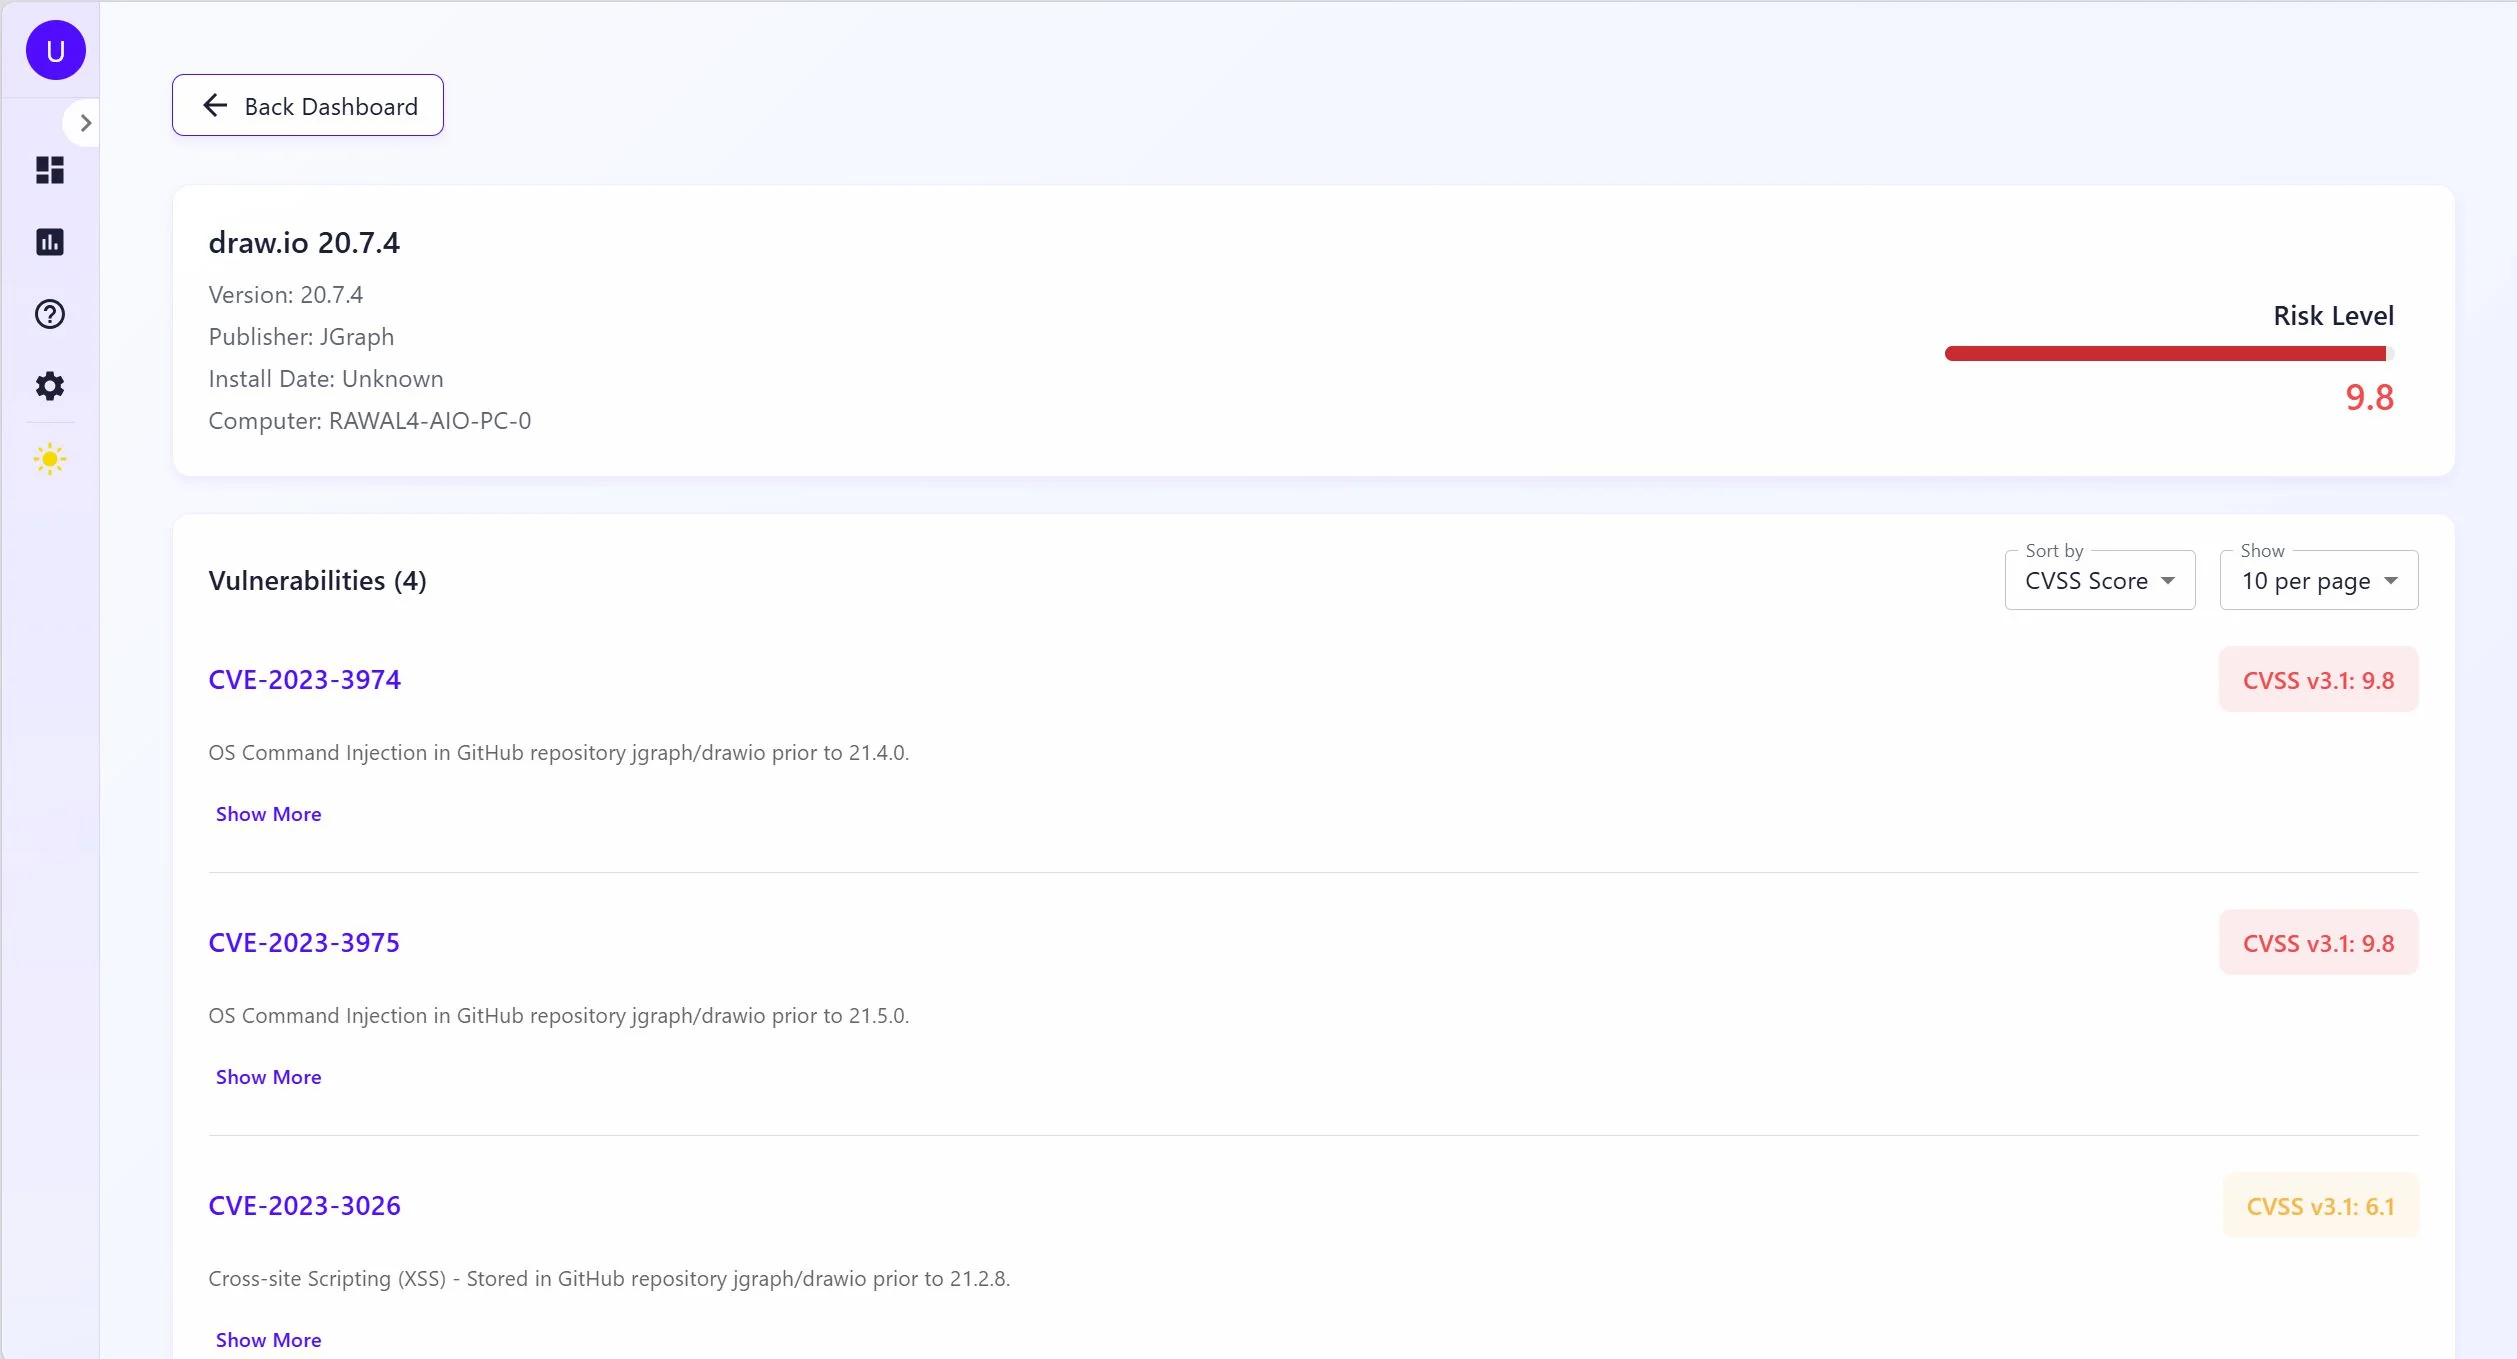
The Go service authenticates to LDAP, pages through computer objects in batches of 1000, then checks each host is actually reachable before touching it. The reachability check runs three probes in order: TCP on SMB port 445, TCP on RPC port 135, ping as a fallback. Offline machines get flagged and skipped: there's no silent dropout from the inventory. For hosts that pass the check, the scanner opens a PowerShell remote session to pull the software inventory: installed applications (both 32-bit and 64-bit registry paths, plus per-user installs), running services, open TCP ports, and system info. You get structured, specific data, not fingerprinting guesses.
The real constraint is WinRM. If PowerShell remoting isn't enabled on a machine (restrictive firewall rules, explicit GPO disabling it), the session won't open and the software inventory won't come back. In a domain environment this is usually a one-line GPO fix. Outside a corporate domain, it's a prerequisite that may not be negotiable.
Four feeds, one index
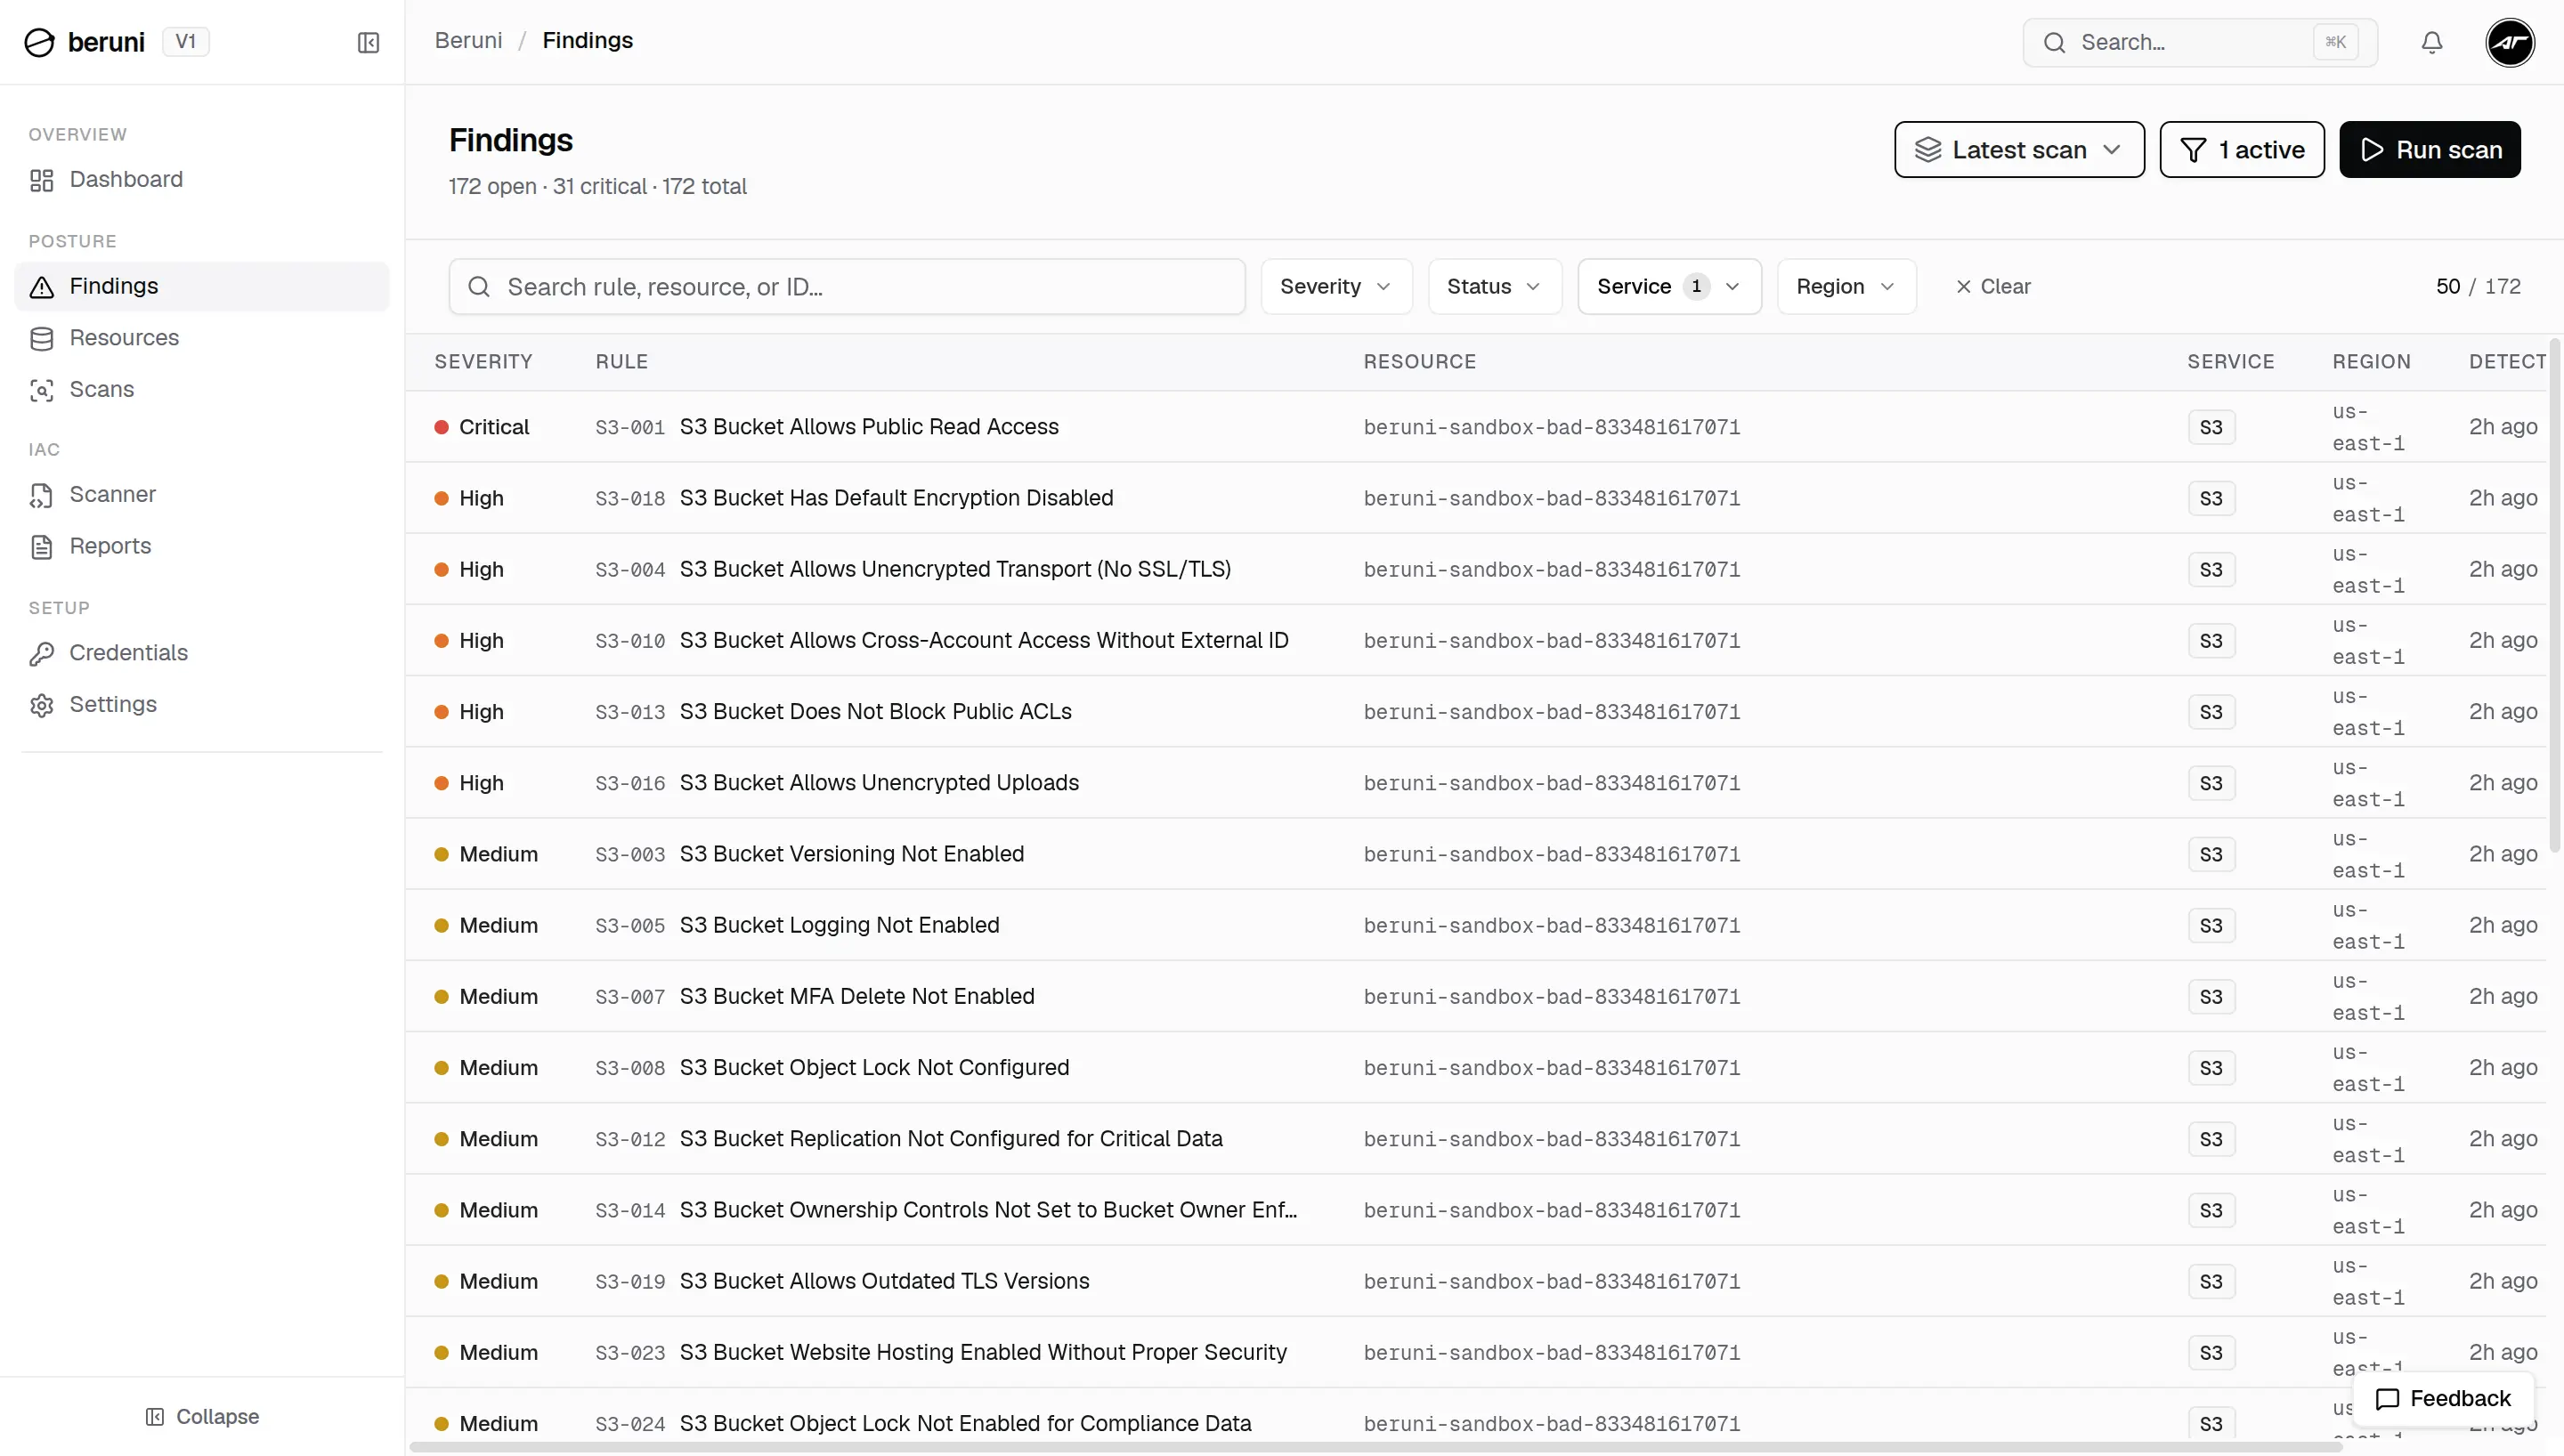
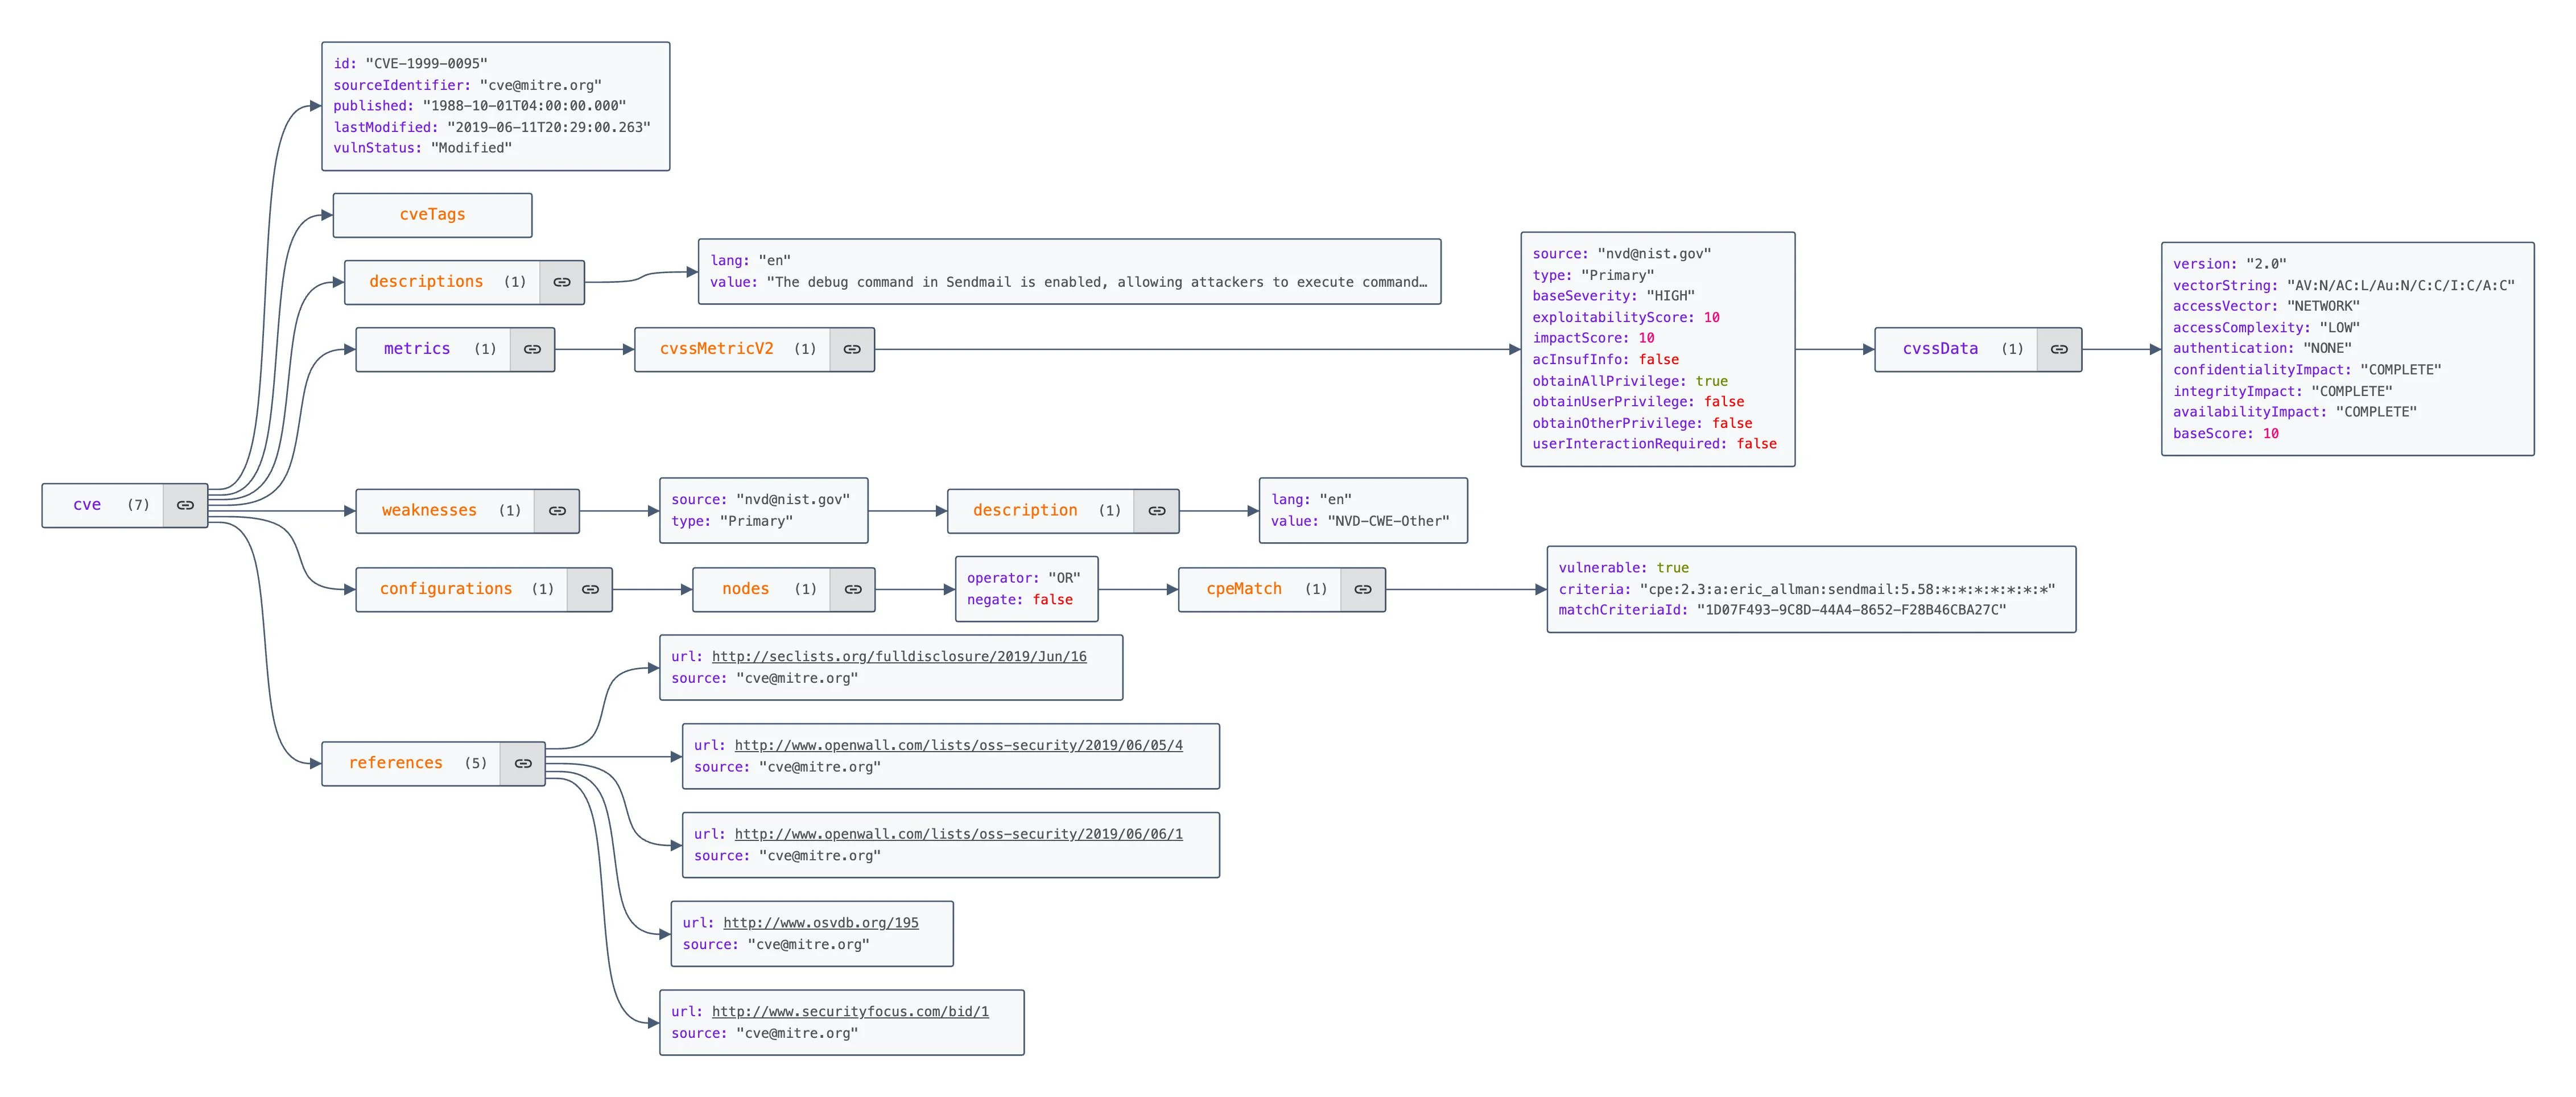
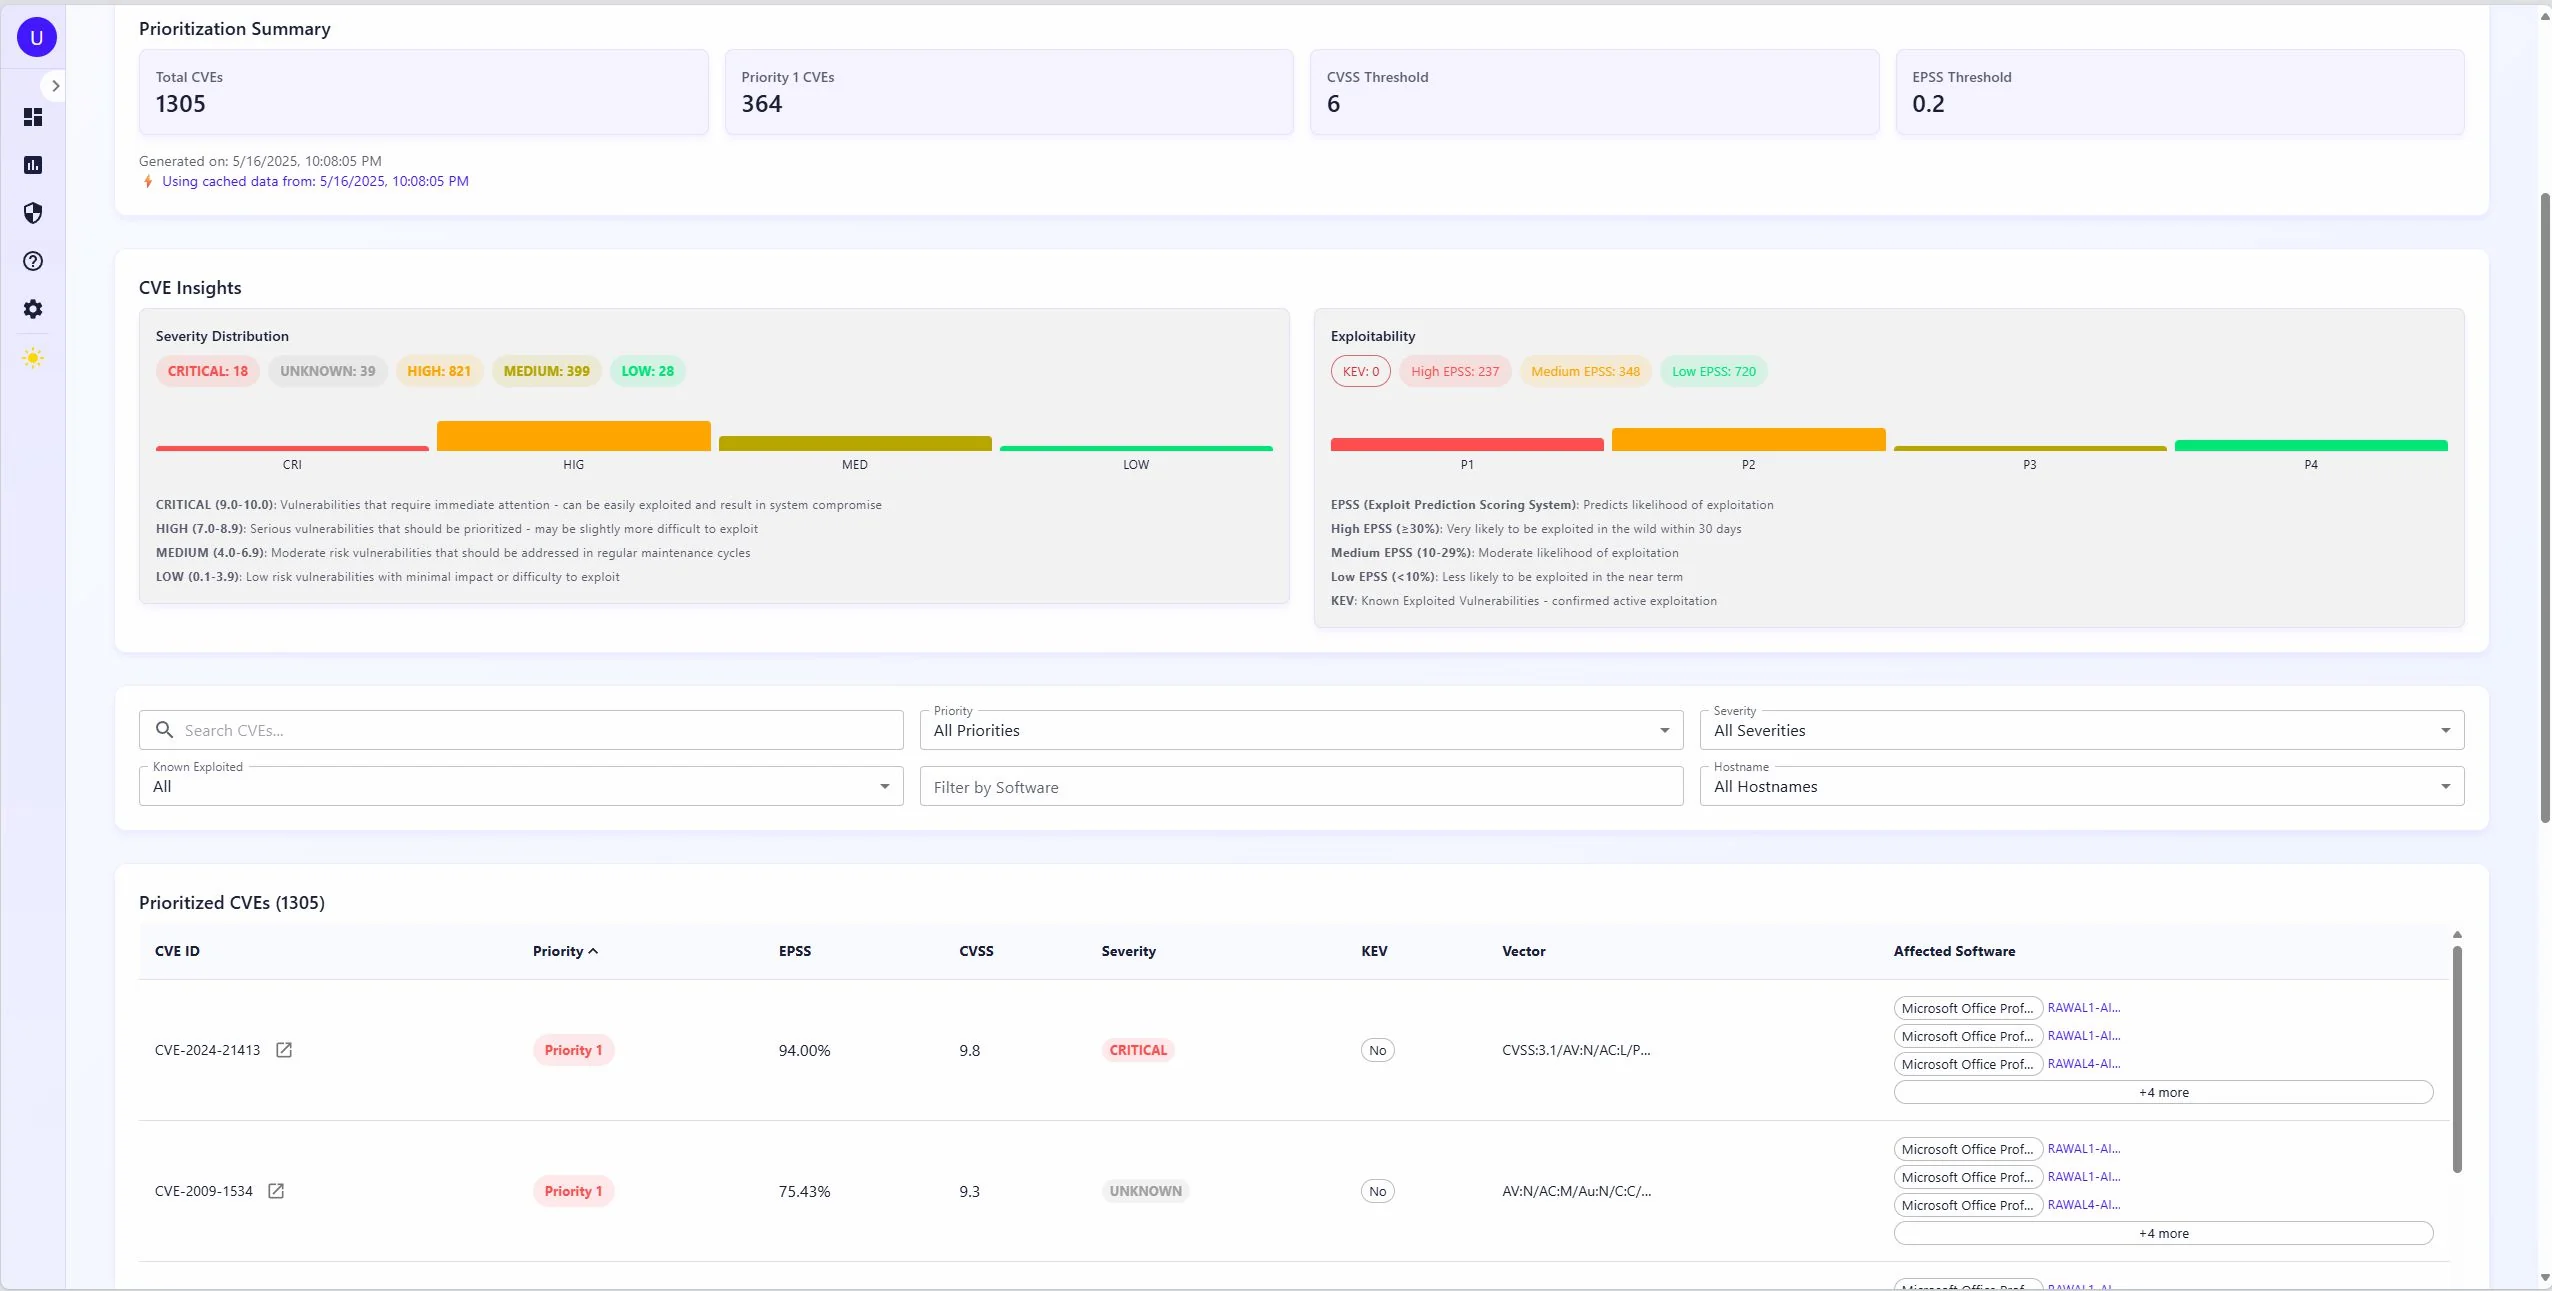
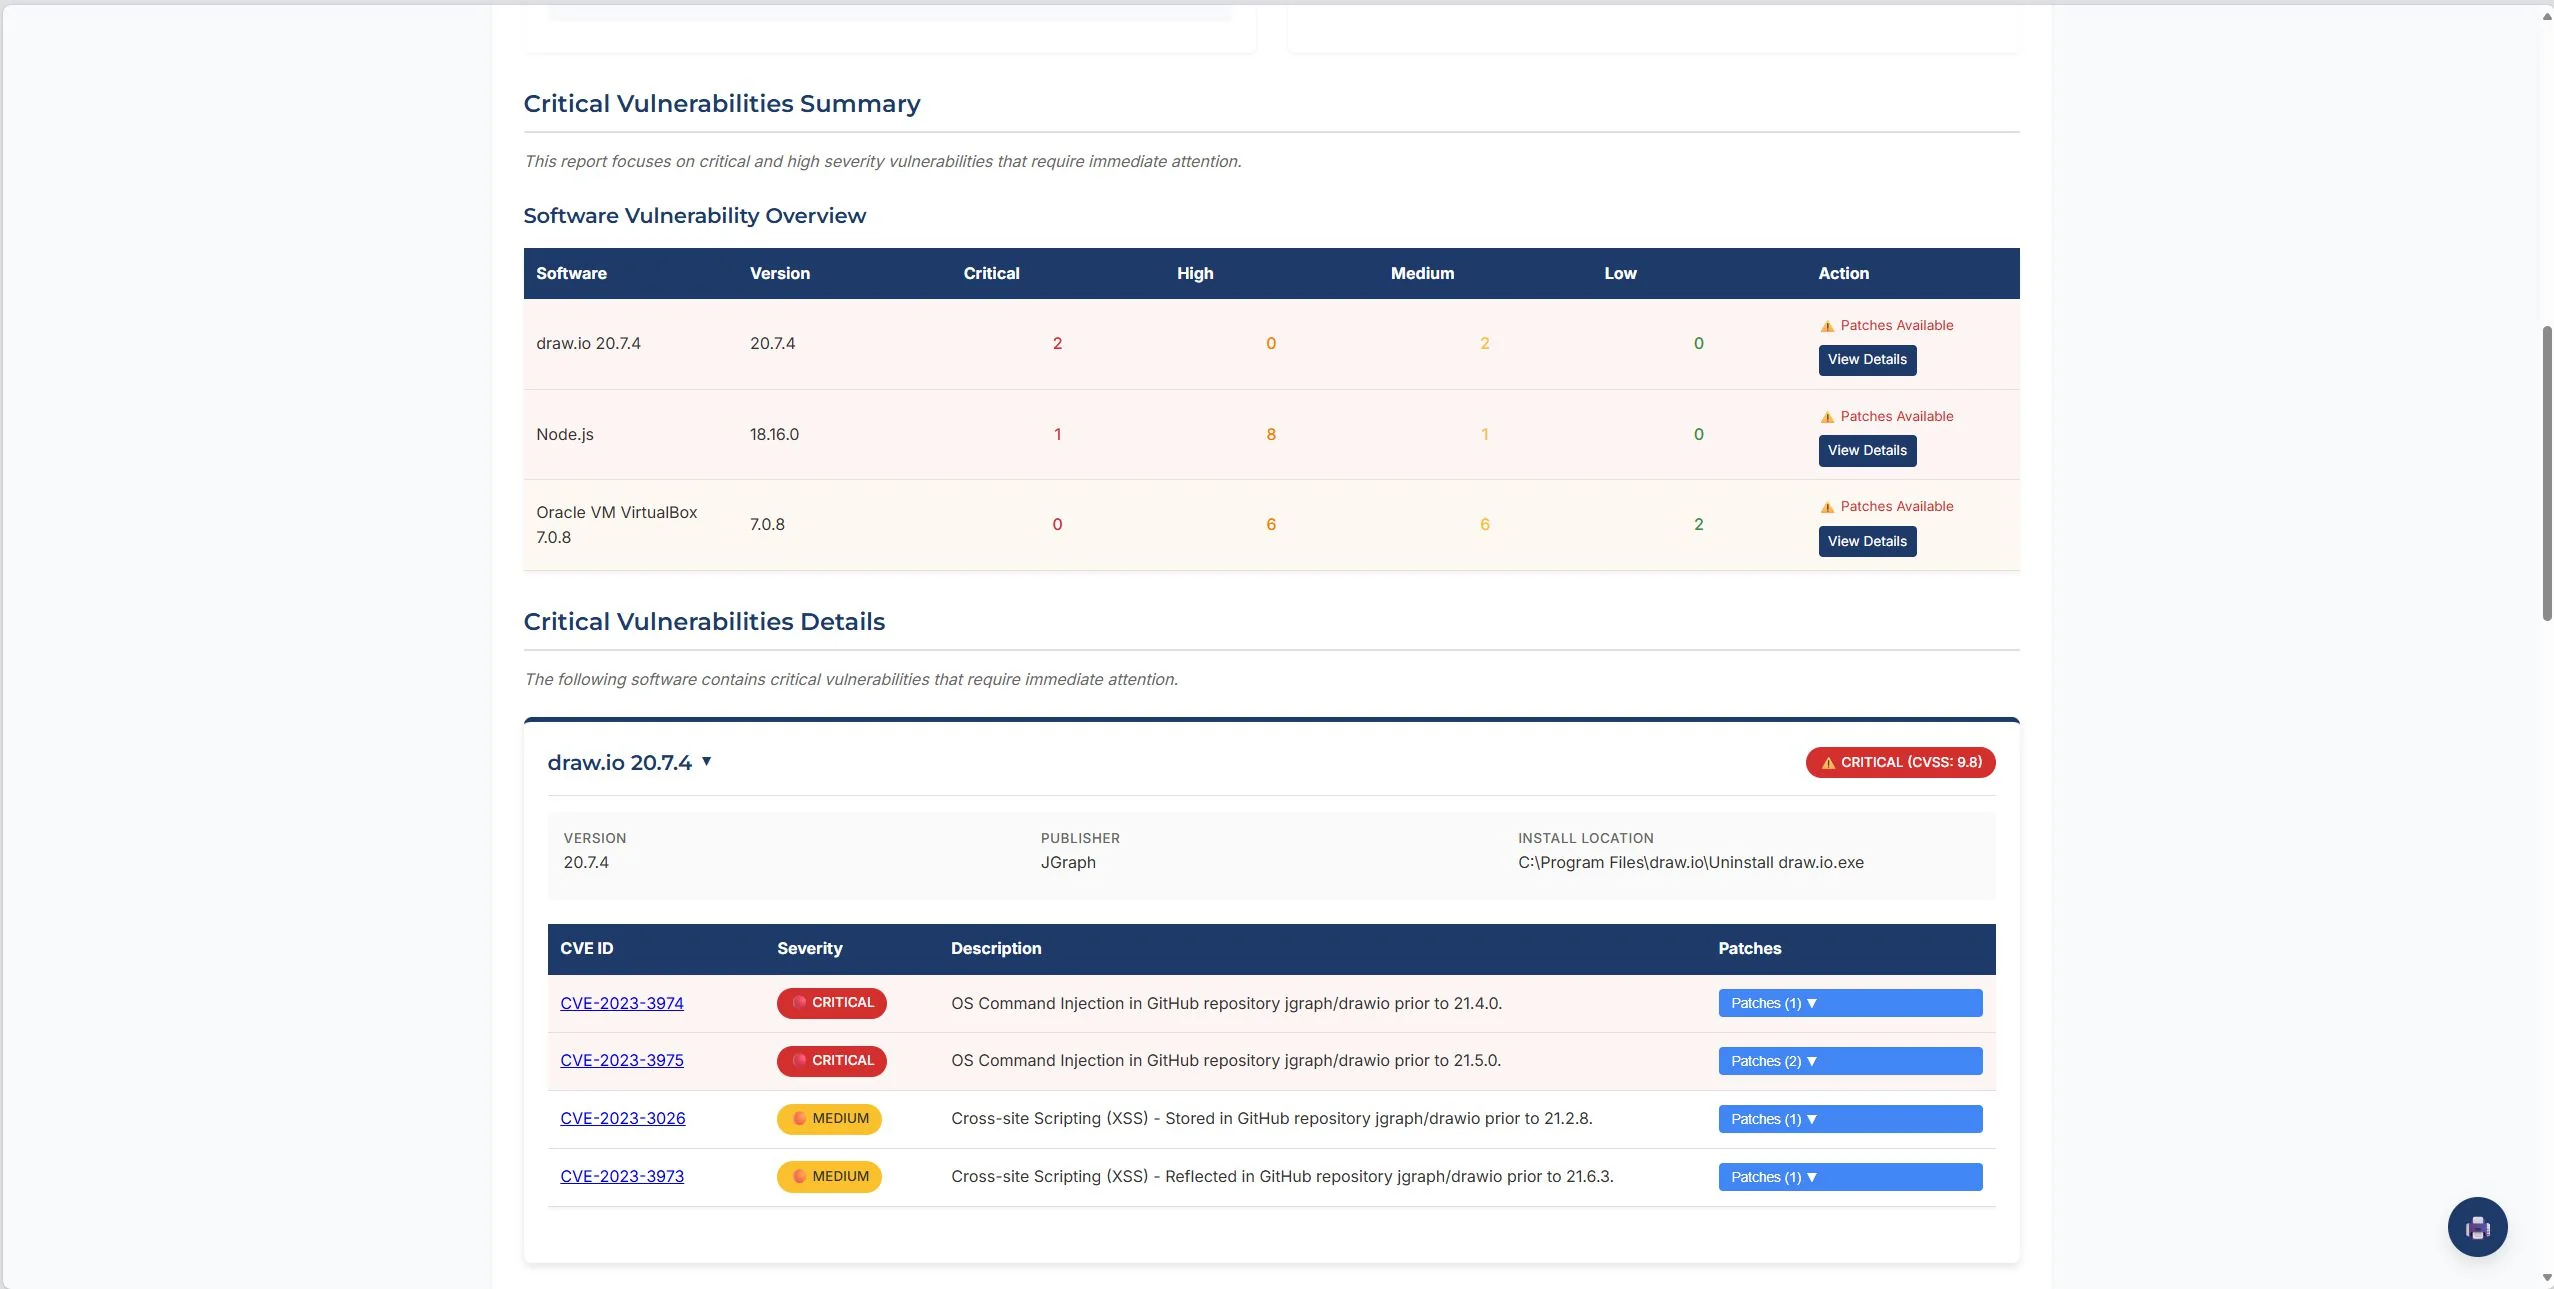
The vulnerability database pulls from four sources into Elasticsearch. NIST NVD is the foundation: CVE descriptions, CVSS scores, CPE mappings. FIRST.org's EPSS adds exploit probability scores, which is where things get interesting: a CVE can have a critical CVSS score but a 0.1% chance of being exploited in the next 30 days, or a medium CVSS score and already showing up in active campaigns. CISA's Known Exploited Vulnerabilities catalog tells you the second case directly: if it's on KEV, someone is using it right now. VulnCheck fills gaps in NVD and adds ransomware association data that NVD doesn't track.
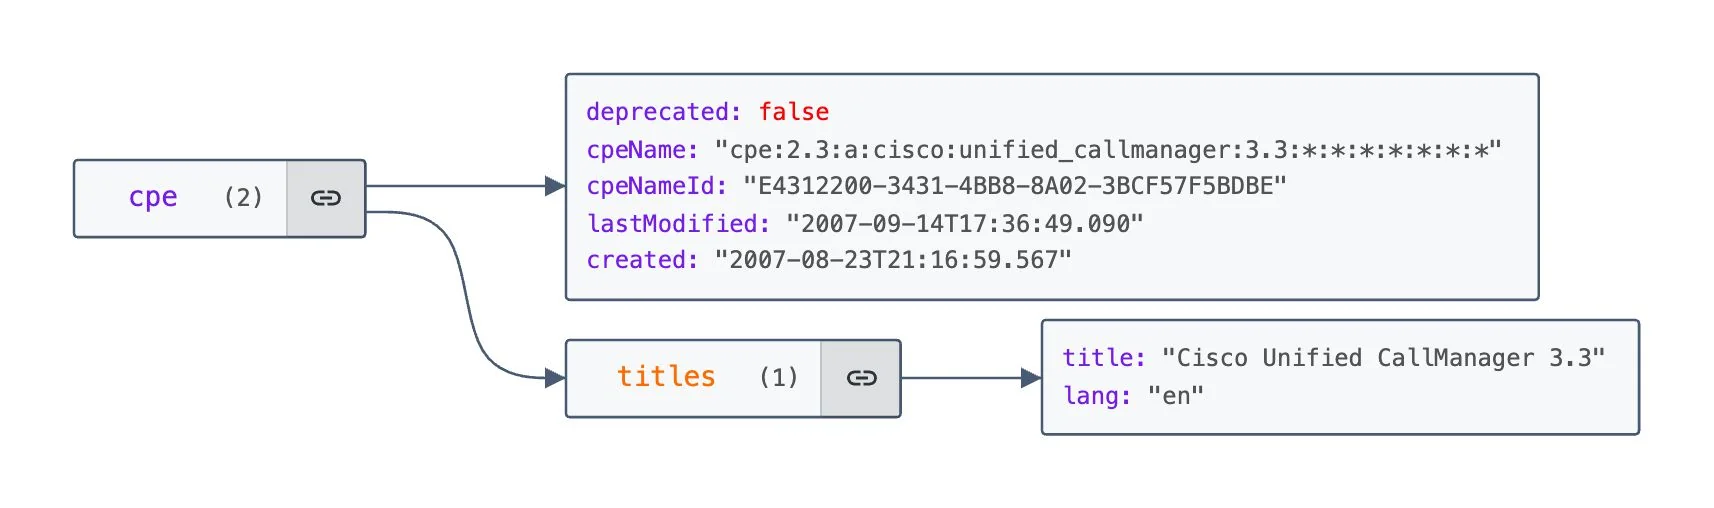
Elasticsearch was the right call for the CVE index. Matching a software inventory against millions of CVEs is CPE string matching with version range logic: that's a search problem, not a join problem. The nested document model for CPE lists fits naturally in a way it wouldn't in Postgres. Lookups run in parallel across a thread pool and results are cached in Redis for 24 hours, so rescanning a network that hasn't changed much is fast. The query itself runs three tiers in order: exact CPE match (highest boost), wildcard version match, then generalized vendor/product match as a fallback, so you get precise hits where the data supports it without dropping results when version strings don't align exactly.
The risk math
Risk scoring uses the model from Reyes et al. [2022]. For each host, we compute a probability of occurrence:
PO = ((avg_TR + avg_EP) / 2) × ((POE + POP) / 2) × AVT
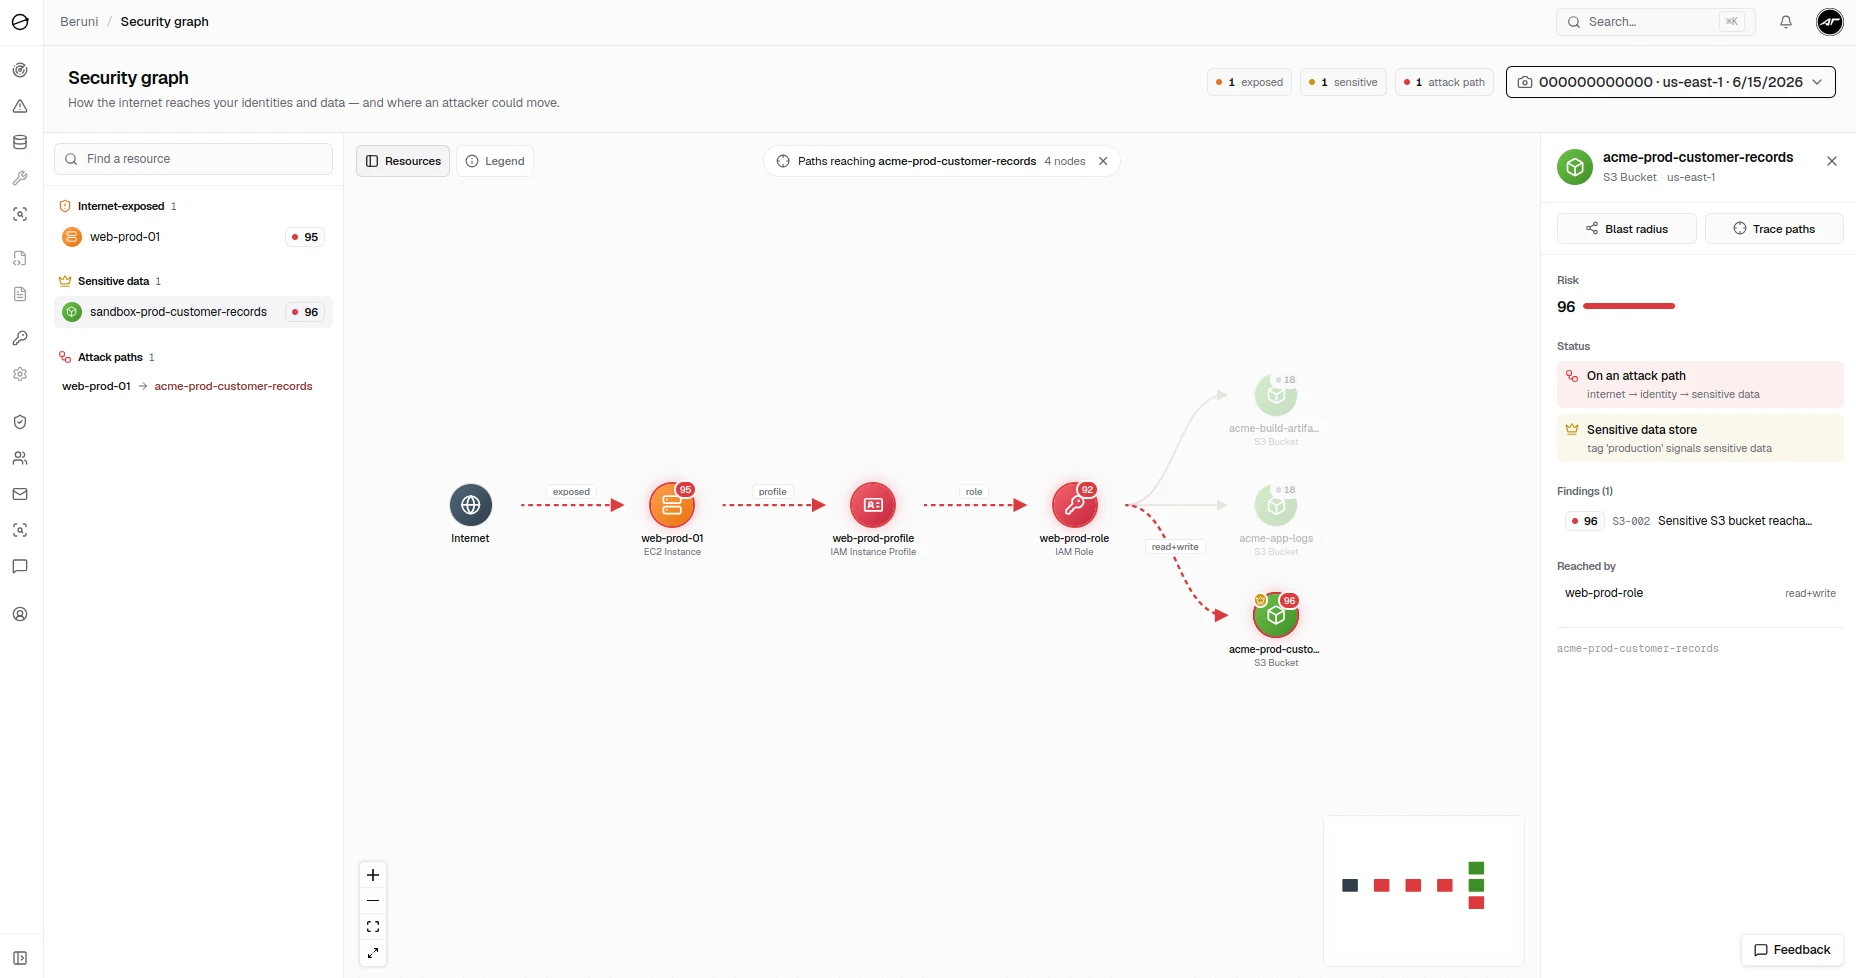
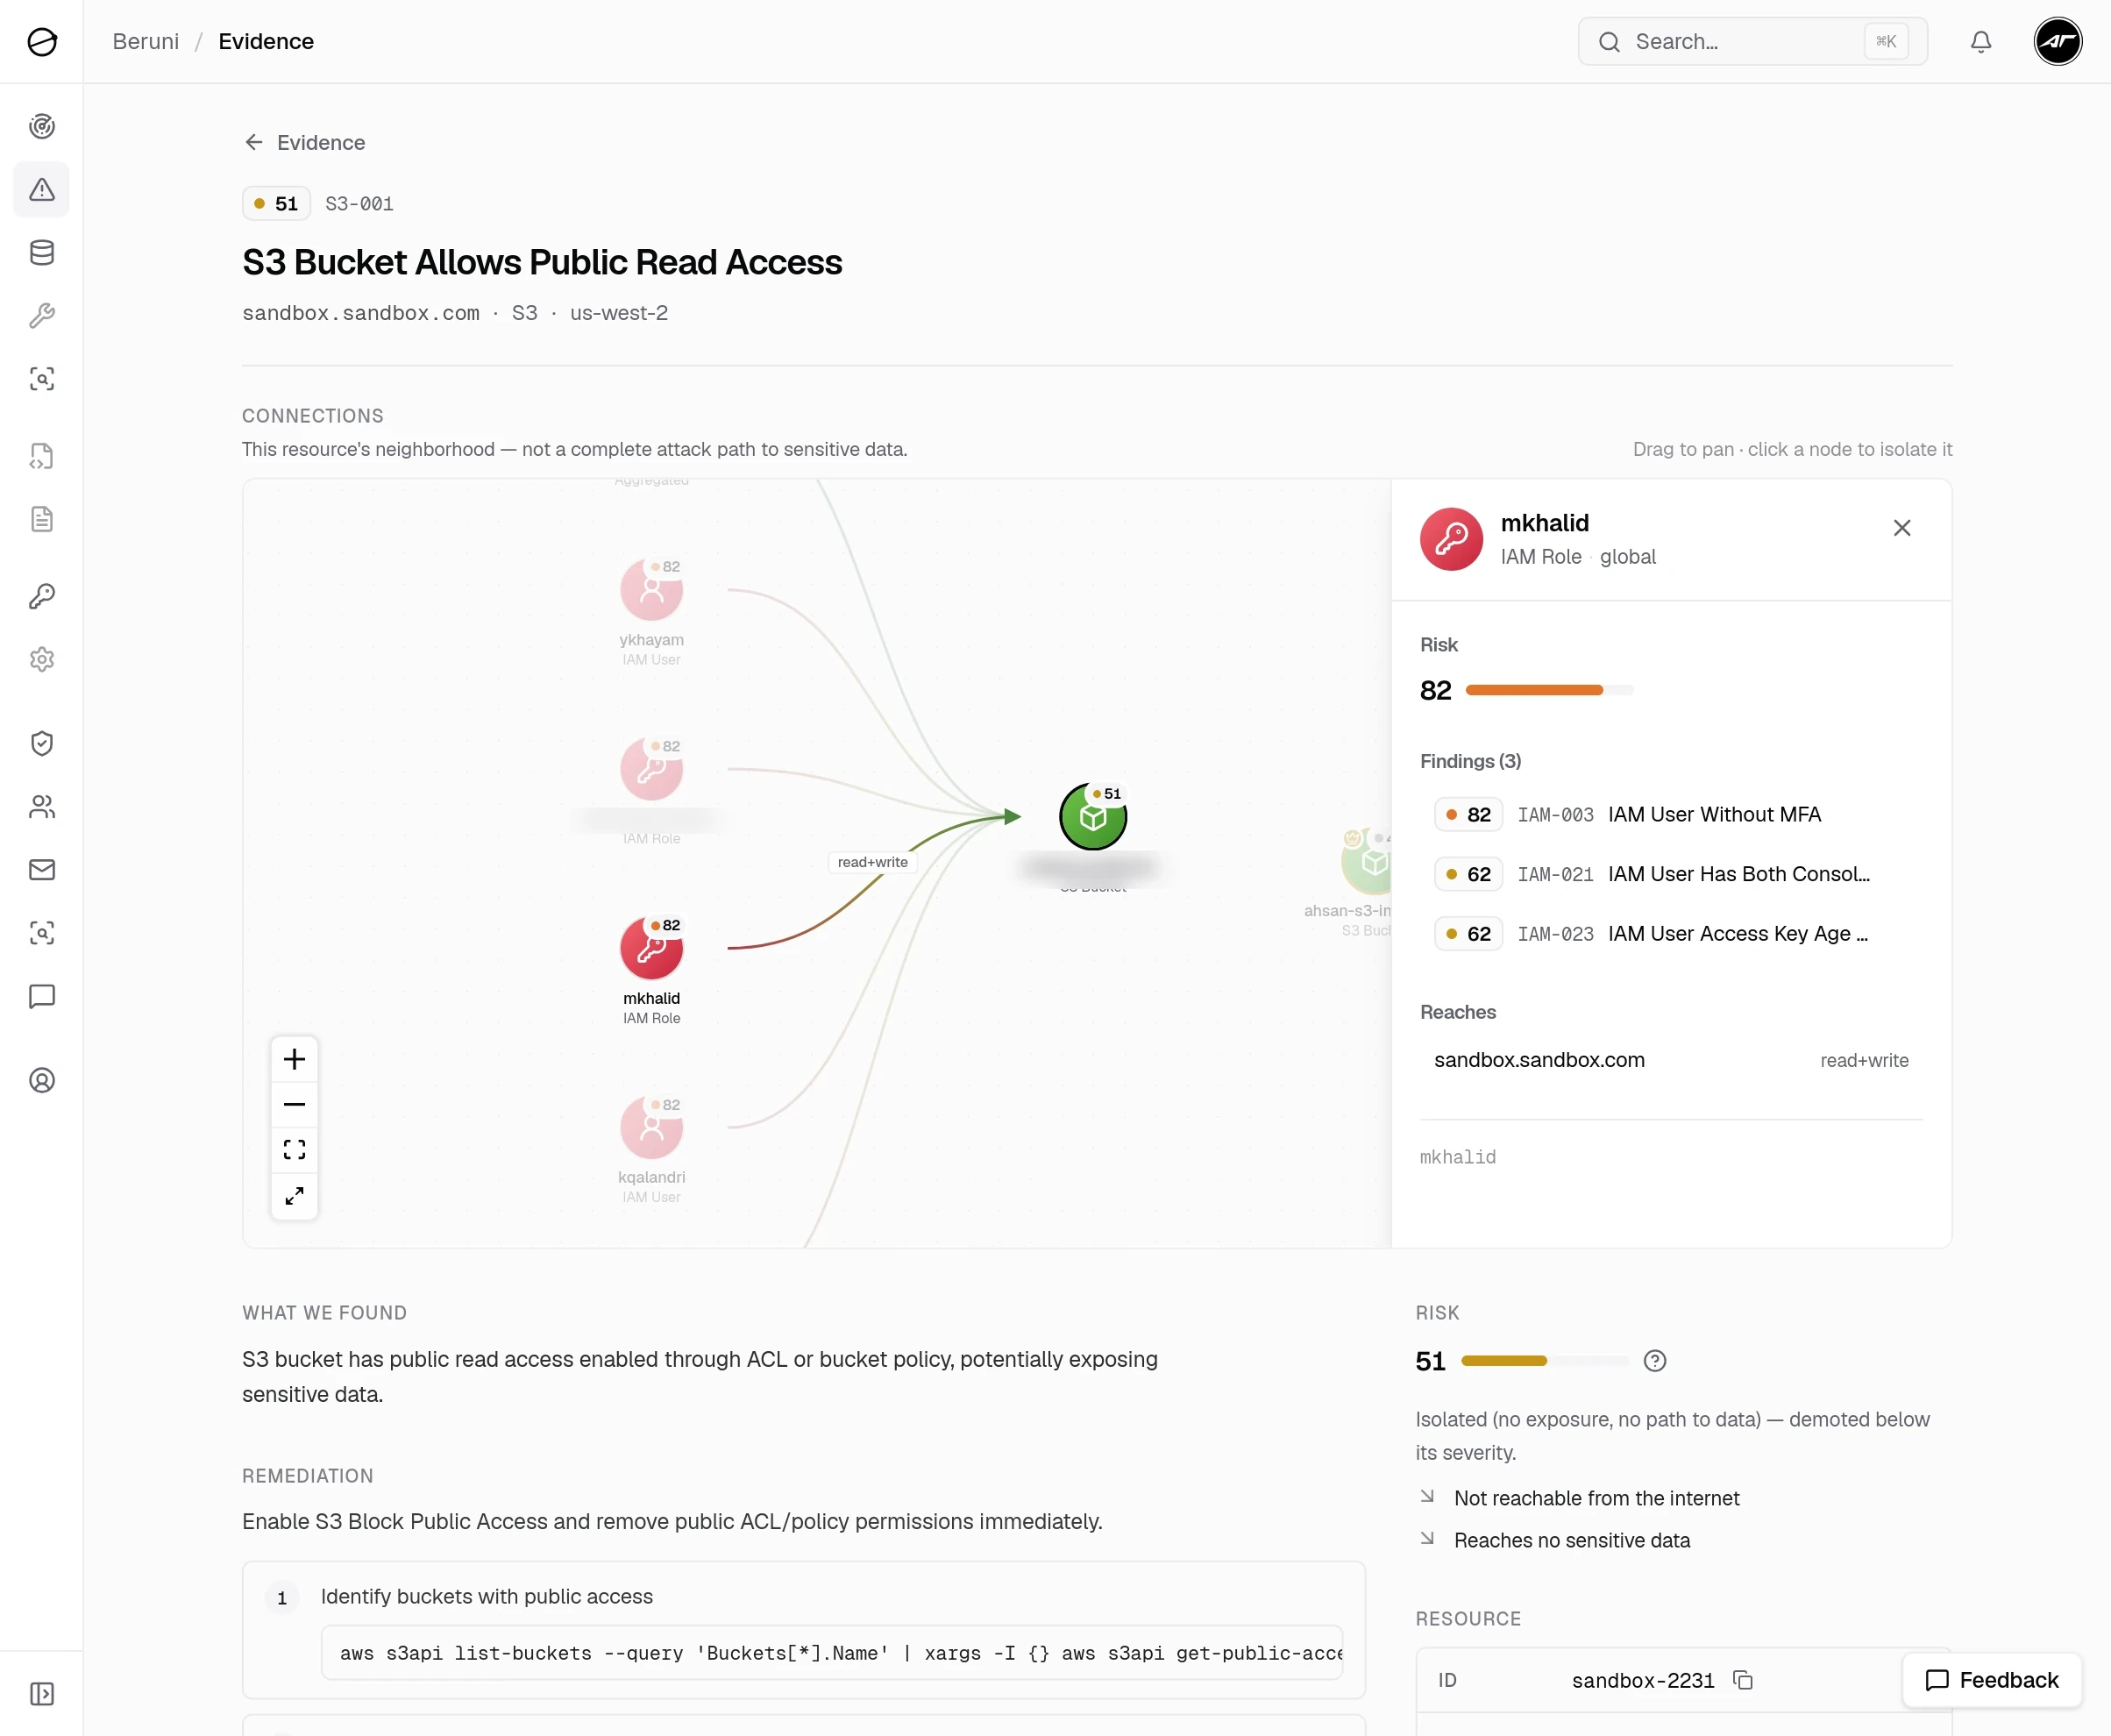
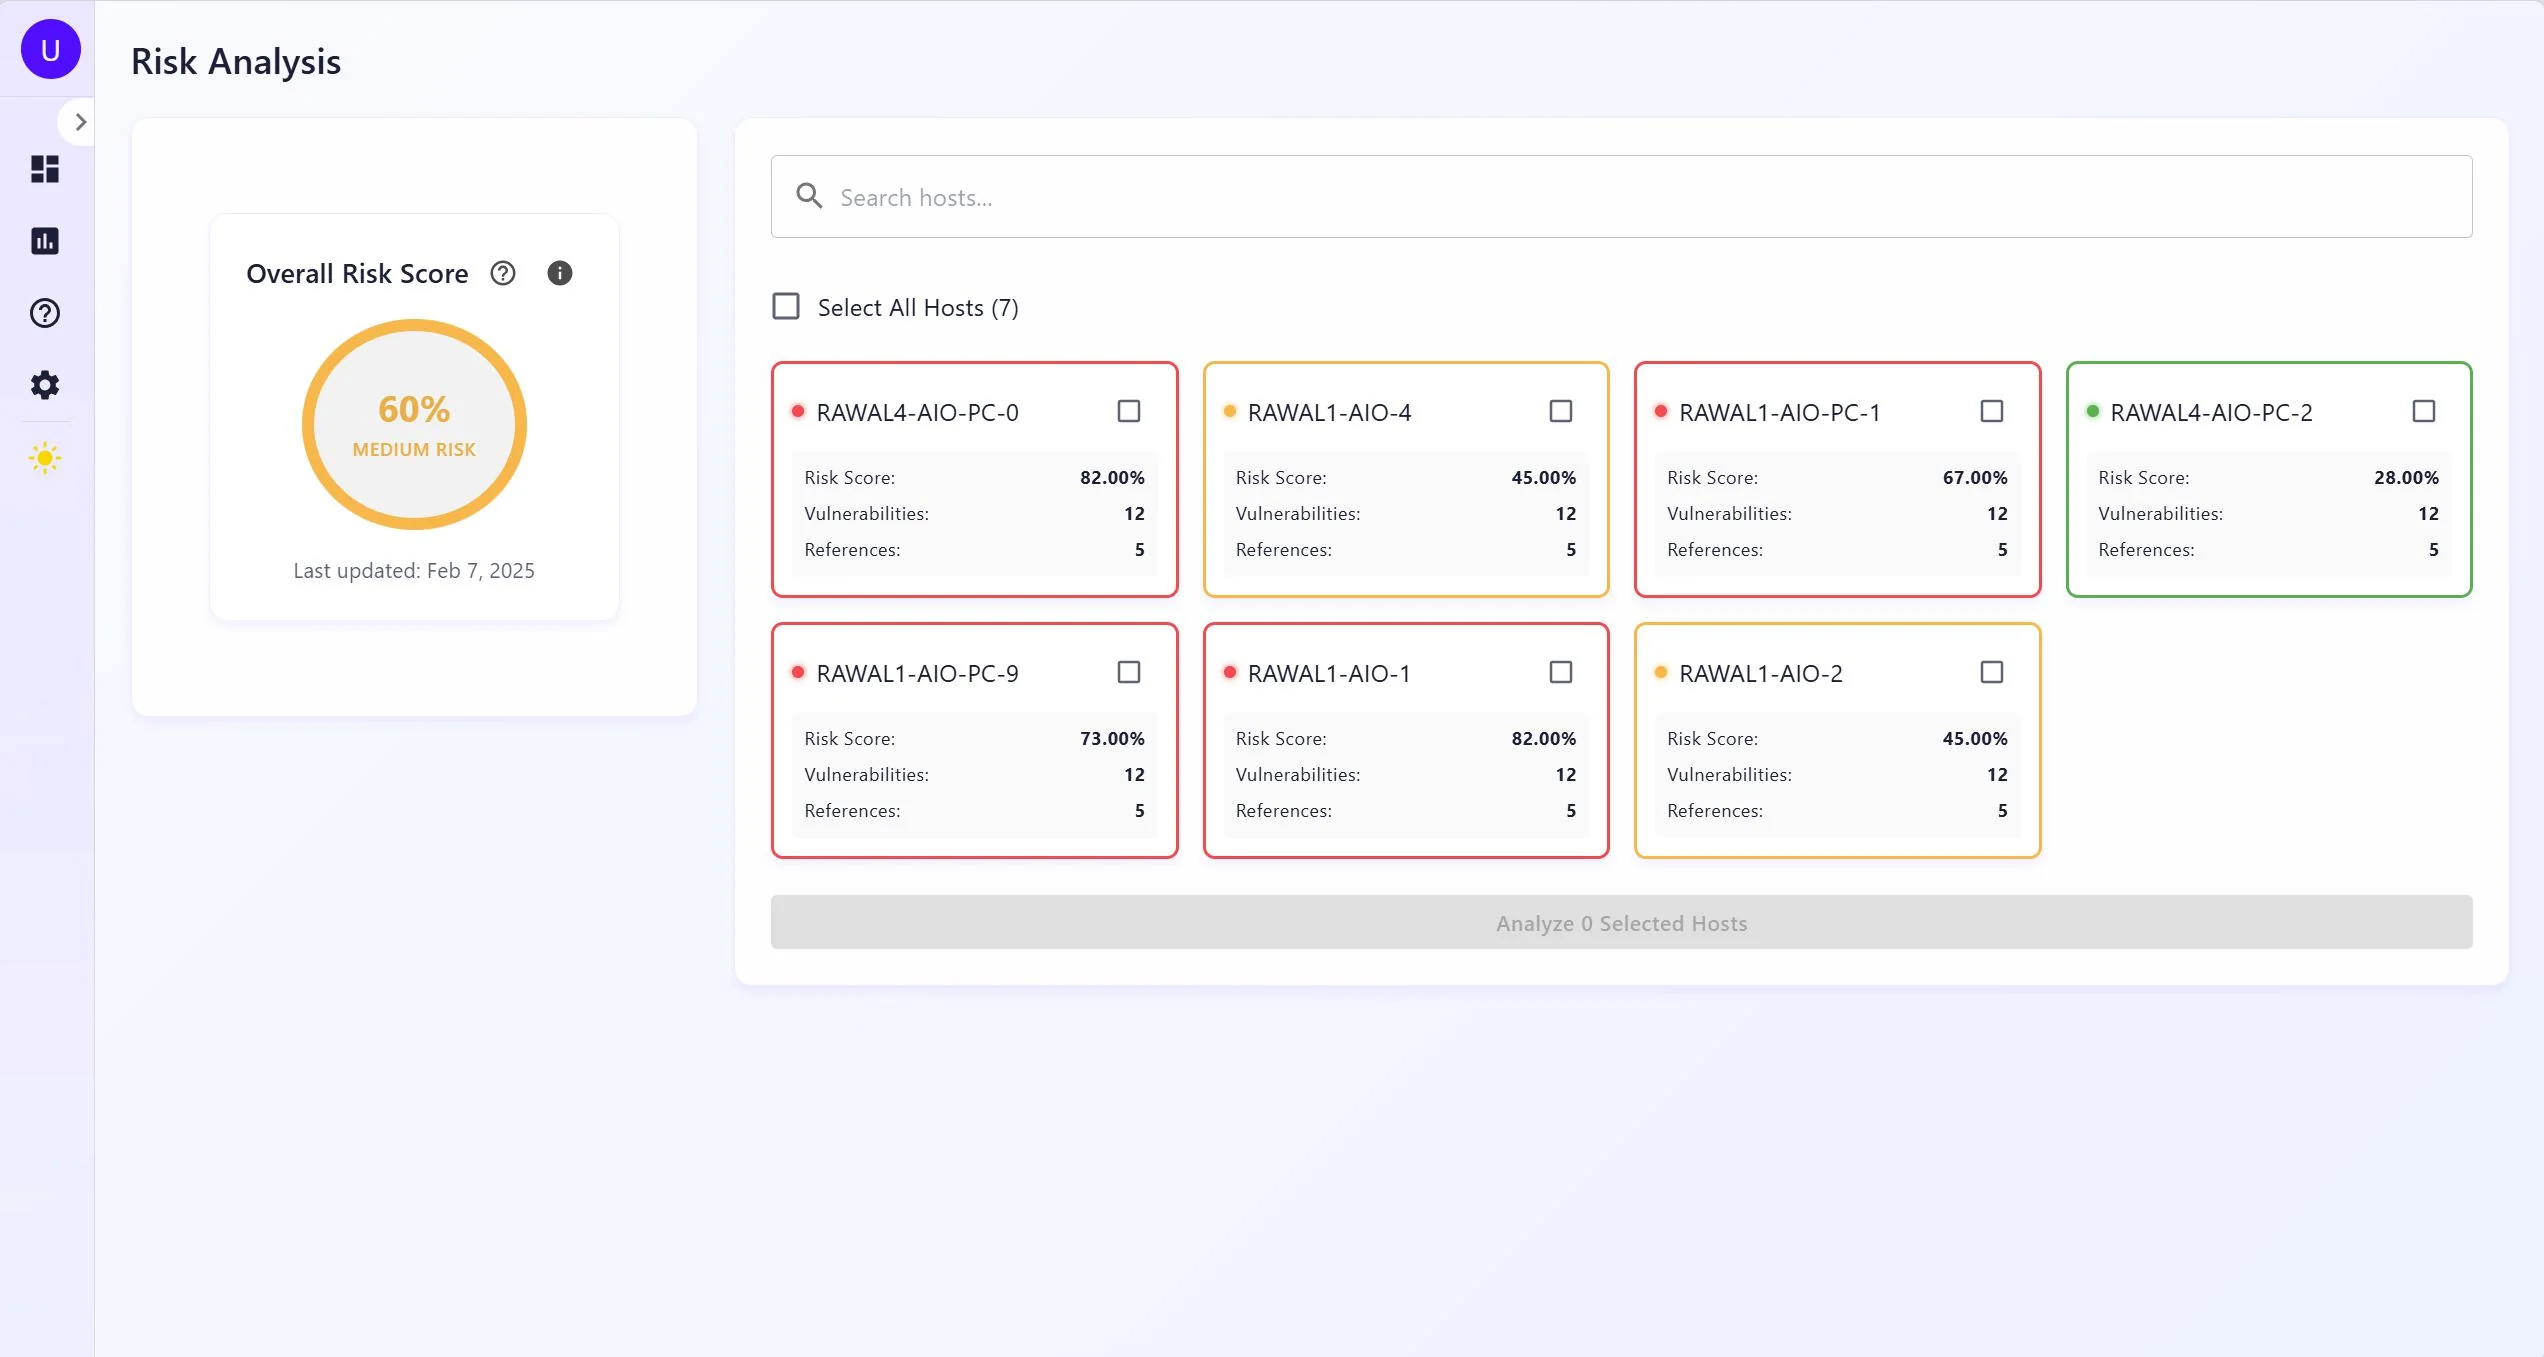
TR is threat reliability from CVE reference counts. EP is exploit probability from EPSS. POE is this host's share of total network CVEs. POP is its share of open ports. AVT is a network-wide age-weighted score that goes up the longer vulnerabilities stay unpatched, which means a host with a two-year-old unpatched CVE scores worse than one with a new one at the same severity. Final risk is PO × avg_impact, bucketed LOW to HIGH.
The thing I keep coming back to in this model: most scanners treat a 6-month-old unpatched CVE the same as a day-old one. AVT doesn't. It creates pressure to actually remediate old findings instead of letting them age out of attention.
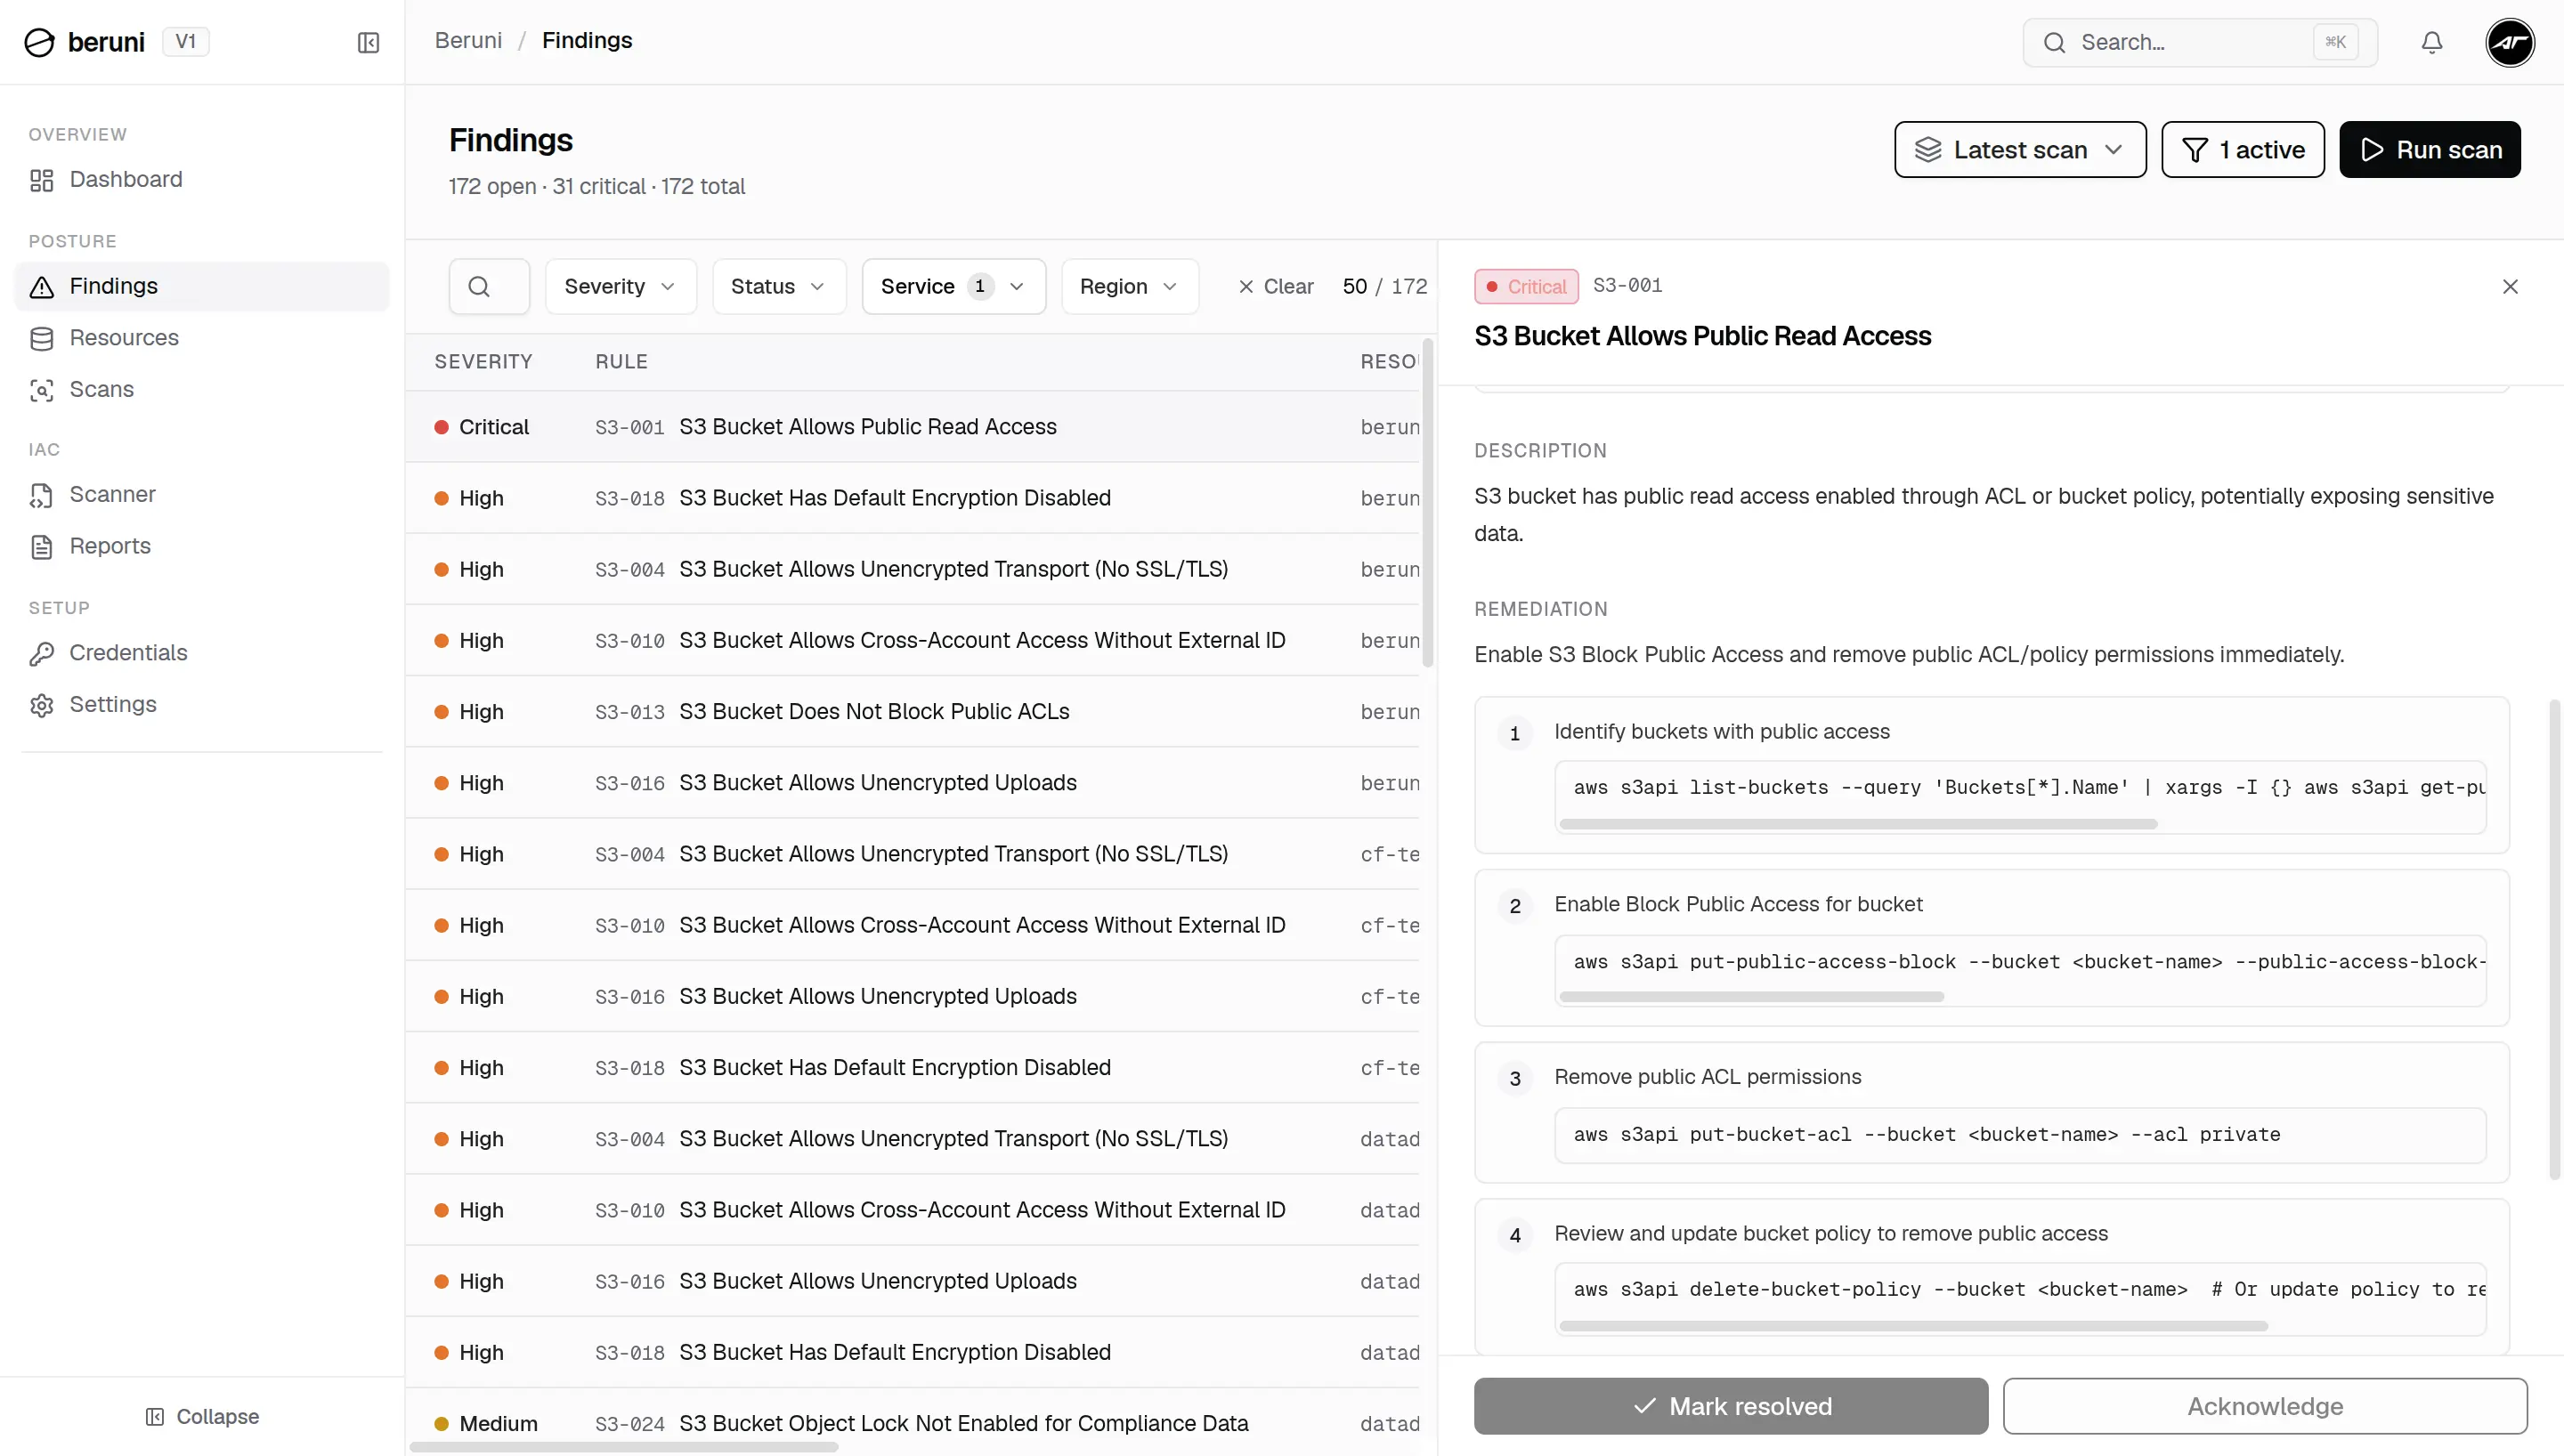
The implementation separates the two signals. PO is returned as its own field alongside the per-CVE impact average, so the risk view can show you worst-severity vulnerabilities without the probabilistic weighting burying them. Both numbers come from the same formula; they're just surfaced independently.
What I'd do differently
Scan jobs are kicked off over REST and you poll /refresh-status for progress. It works. It's also annoying: push the job, get a receipt, receive a completion event when it's done. The architecture would have supported a task queue; we just didn't add one.
The WinRM coverage gap. Unreachable hosts get flagged in the backend. The online check runs before any session attempt, and errors are preserved rather than swallowed. What's missing is a frontend view that surfaces this clearly. There's no dashboard widget that says "these 12 machines haven't been scanned." The data exists; it just doesn't get in your face the way it should. A scan that looks complete but has silent gaps is worse than one that shows you the gaps explicitly.
And observability. We had logs. When a scan ran slow, debugging it meant reading timestamps and doing arithmetic. Traces from day one would have saved hours. This is the lesson I keep relearning on every project.
Full requirements, data models, and test cases are in the project report (PDF).